mikebridge opened a new pull request, #43649:
URL: https://github.com/apache/superset/pull/43649
### SUMMARY With `SEMANTIC_LAYERS` enabled, a chart can be built on a **semantic view** instead of a dataset. In the Charts list, the **Datasource** column for every such chart was blank (no name, no link), and the chart API returned `datasource_name_text: null` / `datasource_url: null` for it — regular-dataset charts on the same page rendered normally. **Root cause.** `Slice`'s display helpers (`datasource_url`, `datasource_name_text`, `datasource_link`, `datasource_edit_url`, `icons`) resolve the datasource only through the `SqlaTable` relationship (`Slice.table`, which is correctly guarded on `datasource_type == 'table'`), so for a `semantic_view` chart they saw `None`. **Fix.** - Add a type-guarded, view-only `Slice.semantic_view` relationship mirroring `Slice.table` (`primaryjoin` on `datasource_id` **and** `datasource_type == 'semantic_view'`, `viewonly=True`, `lazy="selectin"`). - Add a display-only `Slice._display_datasource()` that dispatches on `datasource_type` and never falls back across types; route the five display helpers through it with `getattr` guards, so an unresolved reference yields `None` for that one chart instead of failing the listing. - `datasource_name_text` now delegates to the datasource's own `name` (`schema.table_name` for datasets, the view name for semantic views) — identical output for datasets. - Register the new relationship in the soft-delete purge policy for charts (`PRESERVE`, like `table`); the policy validates every mapper relationship on `Slice`. **Design notes.** - `Slice.datasource` is intentionally unchanged: it is read by access checks, dashboard dataset collection and exports that depend on it being a `SqlaTable`. Reconciling that is a separate follow-up. - `datasource_id` is only unique within a `datasource_type` — a semantic view and a dataset routinely share an id. The guarded join means a semantic-view chart can never be labelled with a same-id dataset (tested with a deliberate collision on real rows). - Loading cost: `selectin` adds one bounded `IN (...)` query per batch of charts loaded (measured: 3 statements for a page of table-only charts, up from 2), in exchange for no per-chart query on semantic-view-heavy list pages. - The `SemanticView` import in `slice.py` is `TYPE_CHECKING`-only: a module-top import is a real cycle (`connectors/sqla/models` → `models/slice` → `semantic_layers/models` → `semantic_layers/mapper` → `connectors/sqla/models`). The relationship names its target as a string. No migration, no new API fields, no frontend change (the list already renders `datasource_name_text` / `datasource_url`). ### BEFORE/AFTER SCREENSHOTS OR ANIMATED GIF Charts list, chart on a Snowflake semantic view (`TPCDS_SEMANTIC_VIEW_SM`): **Before** — empty Datasource cell: 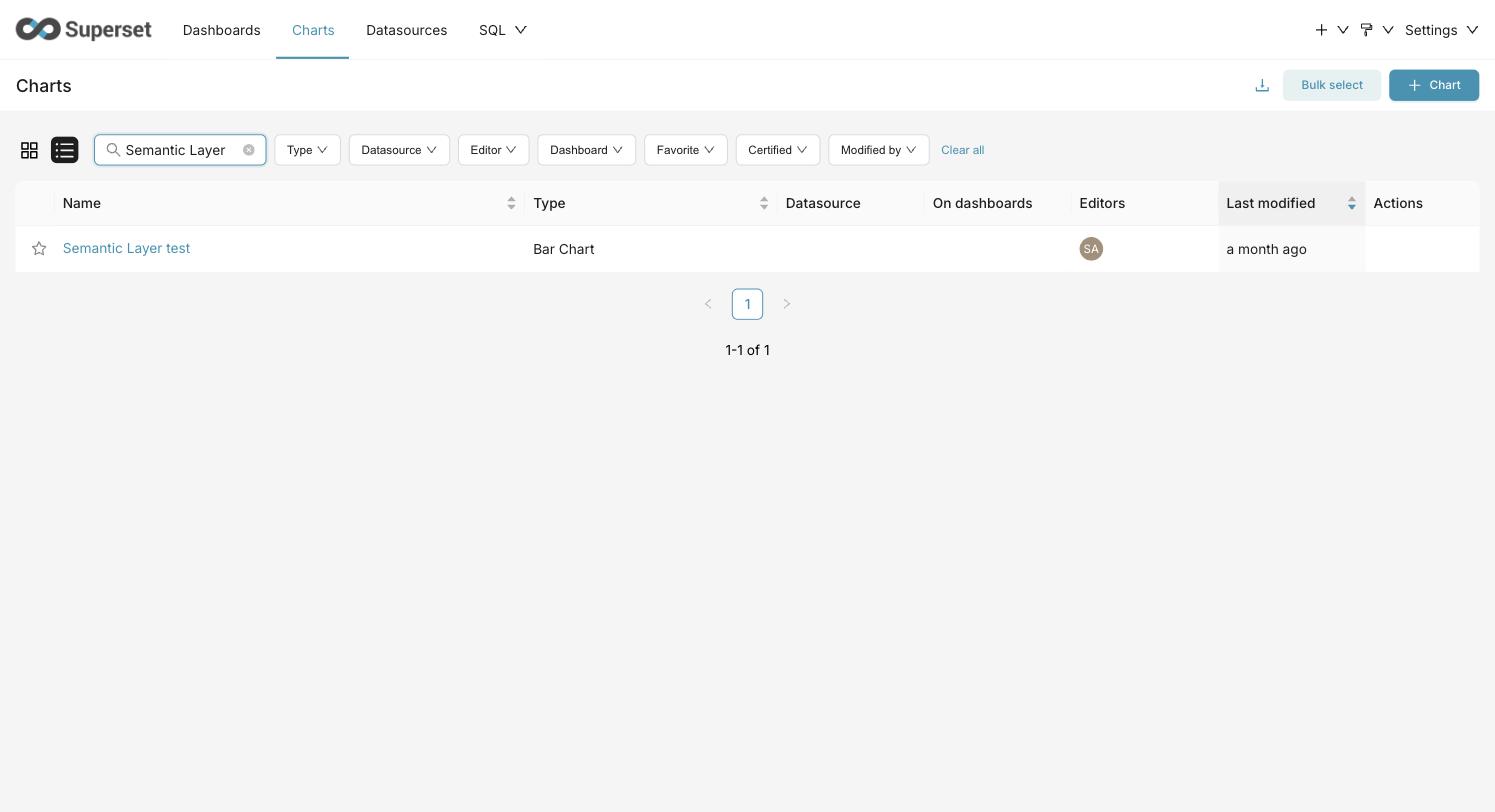 **After** — view name linked to Explore: 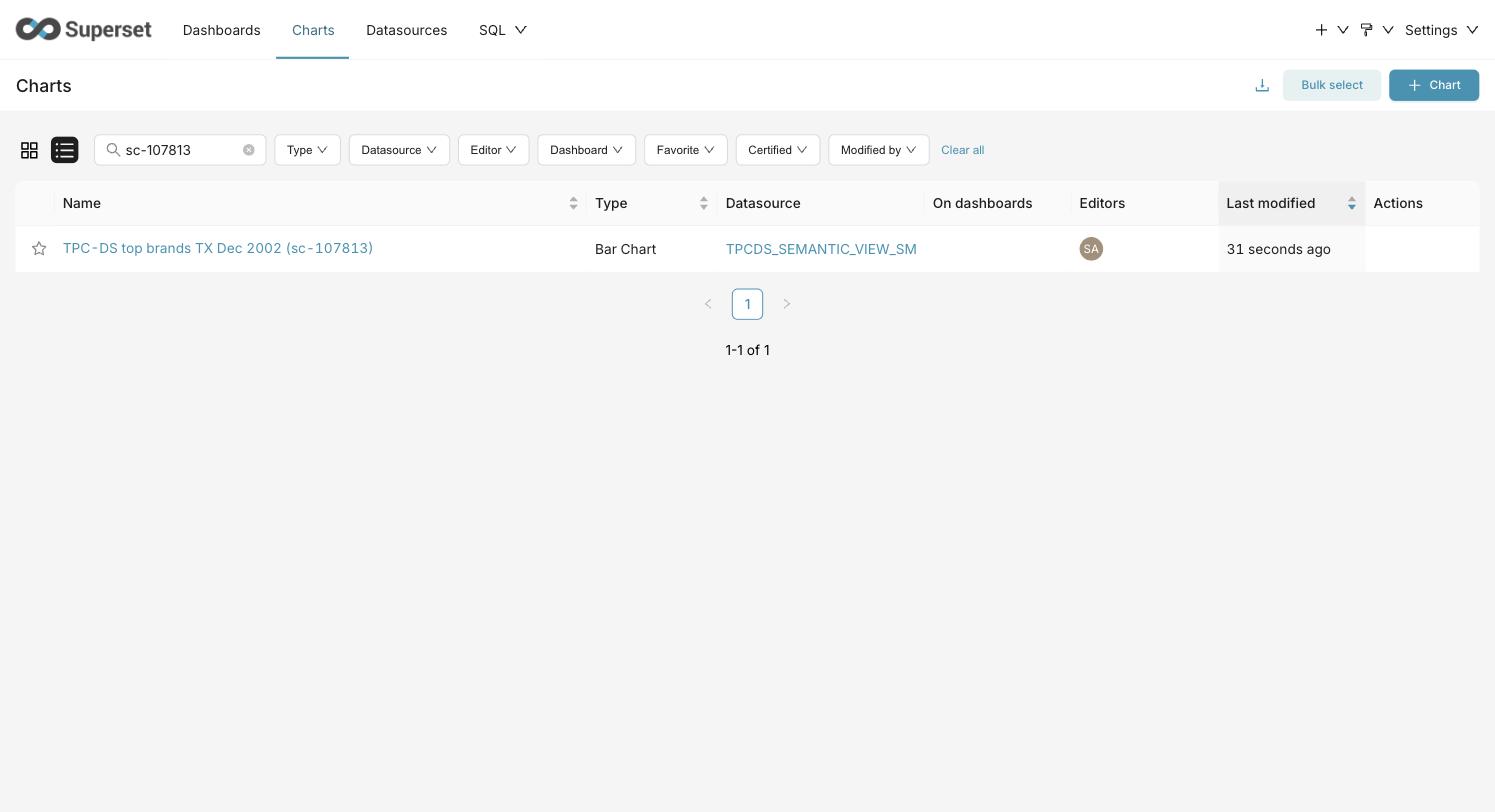 API, same chart: ```json // before {"datasource_type": "semantic_view", "datasource_name_text": null, "datasource_url": null} // after {"datasource_type": "semantic_view", "datasource_name_text": "TPCDS_SEMANTIC_VIEW_SM", "datasource_url": "/explore/?datasource_type=semantic_view&datasource_id=2"} ``` ### TESTING INSTRUCTIONS Automated: ```bash pytest tests/unit_tests/models/slice_test.py tests/unit_tests/charts/test_chart_list_datasource.py tests/unit_tests/commands/deletion_retention/ -W error::sqlalchemy.exc.SAWarning ``` `test_chart_list_datasource.py` uses real SQLite rows with a semantic view and a dataset sharing the same id, plus a chart on each: the semantic-view chart resolves to the view, the dataset chart to the dataset; a dangling view id degrades to `null` fields without error; holds with `SEMANTIC_LAYERS` off. Manual (feature flag `SEMANTIC_LAYERS` on): 1. Add a semantic layer + semantic view (any provider; the in-memory demo layer works) and save a chart on it. 2. **Charts** list → the Datasource cell shows the view's name as a link; clicking it opens Explore on `datasource_type=semantic_view&datasource_id=<id>`. 3. `GET /api/v1/chart/<id>` → `datasource_name_text` and `datasource_url` are populated. 4. A chart on a regular dataset renders exactly as before. 5. Optional collision check: if a dataset with the same numeric id as the view exists, the semantic-view chart still names the view. ### ADDITIONAL INFORMATION <!--- Check any relevant boxes with "x" --> <!--- HINT: Include "Fixes #nnn" if you are fixing an existing issue --> - [ ] Has associated issue: - [x] Required feature flags: `SEMANTIC_LAYERS` (to reproduce; the fix itself is flag-independent) - [x] Changes UI - [ ] Includes DB Migration (follow approval process in [SIP-59](https://github.com/apache/superset/issues/13351)) - [ ] Migration is atomic, supports rollback & is backwards-compatible - [ ] Confirm DB migration upgrade and downgrade tested - [ ] Runtime estimates and downtime expectations provided - [ ] Introduces new feature or API - [ ] Removes existing feature or API Known adjacent gaps, deliberately not in this PR: the Charts-list "Dataset" filter dropdown and text search still only cover regular datasets, and the chart access filter joins `datasource_id` to datasets without a type guard — same id-collision family, tracked separately. 🤖 Generated with [Claude Code](https://claude.com/claude-code) -- This is an automated message from the Apache Git Service. To respond to the message, please log on to GitHub and use the URL above to go to the specific comment. To unsubscribe, e-mail: [email protected] For queries about this service, please contact Infrastructure at: [email protected] --------------------------------------------------------------------- To unsubscribe, e-mail: [email protected] For additional commands, e-mail: [email protected]


