abhinav-phi opened a new pull request, #44212:
URL: https://github.com/apache/superset/pull/44212
### SUMMARY Temporal tooltips on charts that span multiple years drop the year. The default "Adaptive formatting" tooltip time format resolves to the `smart_date_verbose` preset, whose `day`/`week` tiers are `'%a %b %-e'`, so a daily-granularity point renders as "Thu Mar 20" and the reader has to look down at the x-axis to know which year they're in (reported in #44149 with a 2014–2026 scatter). This PR adds `%Y` to the `day`/`week` tiers of `smart_date_verbose`, so tooltips read "Thu Mar 20 2016" as requested in the issue. Surfaces affected — the full list of places `smart_date_verbose` renders, all of them tooltip/timestamp surfaces: - Time-series family tooltips (Timeseries incl. scatter, Mixed Timeseries, Gantt) via `getTooltipTimeFormatter`, when "Tooltip time format" is left at the default "Adaptive formatting" and no time grain is set. With a time grain, tooltips already include the year (e.g. `2021-01-07` for a day grain), so those are unchanged. - Time Pivot tooltip time labels. - Big Number (time-series mode) "Show timestamp" text under the metric. Not affected: chart x-axis tick labels (they use the non-verbose `smart_date` preset via `getXAxisFormatter`), tooltips where the user picked an explicit d3 format in the "Tooltip time format" control, and the month/year tiers (already year-bearing: `Mar 2020`, `2020`). ### BEFORE/AFTER SCREENSHOTS OR ANIMATED GIF Hovering a mid-March 2016 point on a 2014–2026 scatter: | Before | After | | --- | --- | | 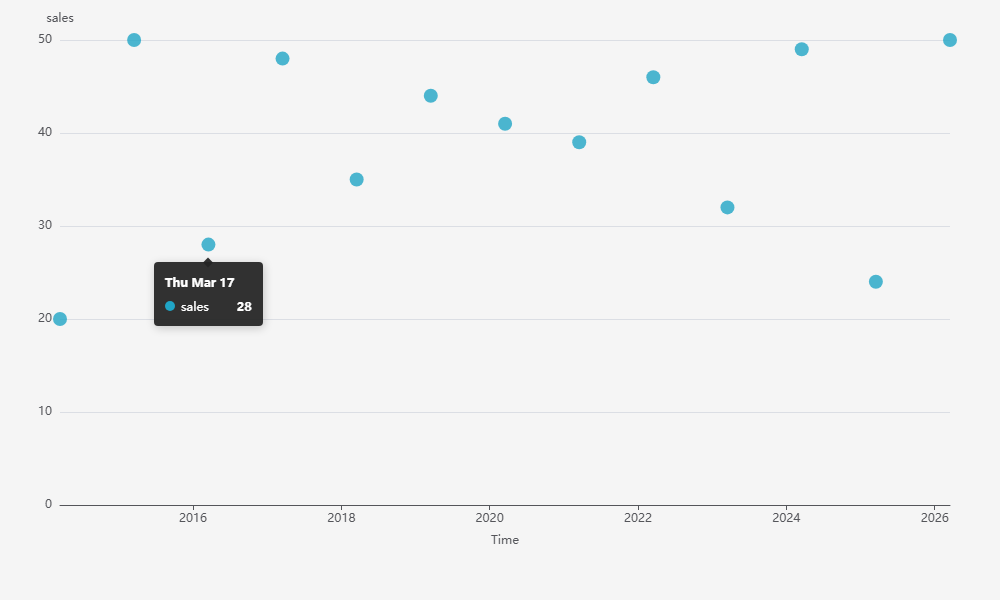 | 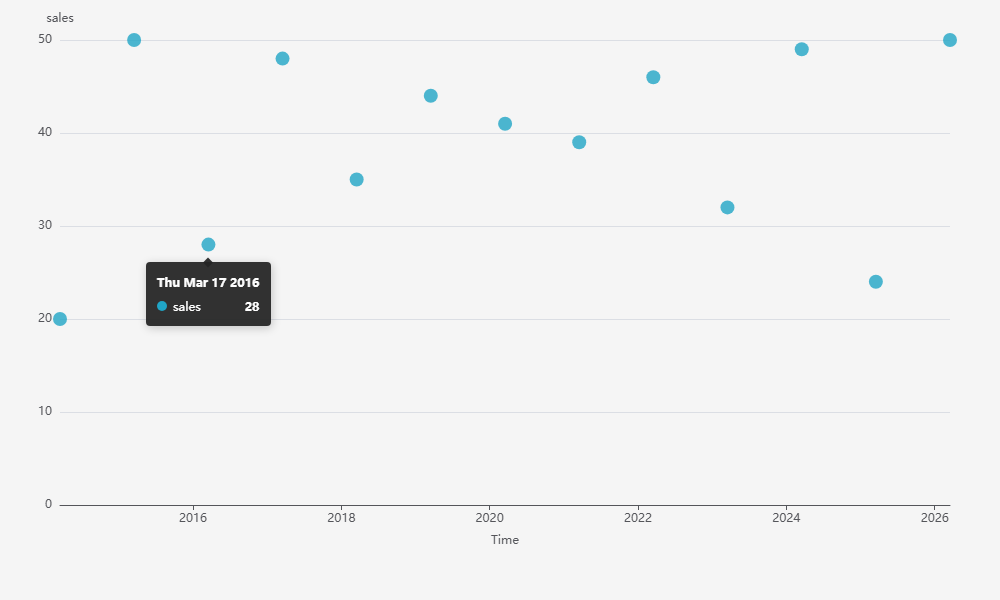 | (Reproduction harness uses the actual `smart_date_verbose` d3 format strings via `d3.utcFormat`, which is what `createMultiFormatter` applies.) ### TESTING INSTRUCTIONS 1. Unit tests: `cd superset-frontend && npx jest packages/superset-ui-core/test/time-format/formatters/smartDateVerbose.test.ts` 2. Manually: create a Time-series (scatter) chart with a temporal x-axis spanning several years and daily-granularity data; leave "Tooltip time format" at its default ("Adaptive formatting"); hover a data point — the tooltip now reads "Thu Mar 20 2016" instead of "Thu Mar 20". ### ADDITIONAL INFORMATION - [x] Has associated issue: Fixes #44149 - [ ] Required feature flags: - [x] Changes UI - [ ] Includes DB Migration (follow approval process in [SIP-59](https://github.com/apache/superset/issues/13359)) - [ ] Introduces new feature or API - [ ] Removes existing feature or API -- This is an automated message from the Apache Git Service. To respond to the message, please log on to GitHub and use the URL above to go to the specific comment. To unsubscribe, e-mail: [email protected] For queries about this service, please contact Infrastructure at: [email protected] --------------------------------------------------------------------- To unsubscribe, e-mail: [email protected] For additional commands, e-mail: [email protected]


