Hi,

I am trying to create a non-uniform colormap in Paraview 4.4 (OSX).
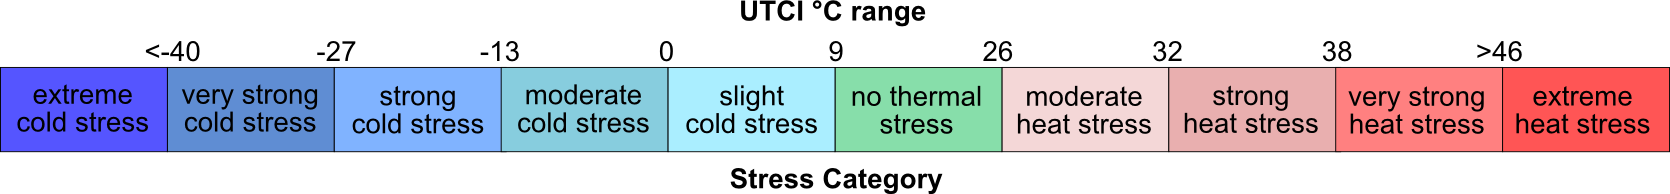
The final goal is to generate a contour with discrete bands based on the
colours in this image

http://james-ramsden.com/wp-content/uploads/2015/07/UTCI_scale.png

My current colormap file is

<ColorMaps>
    <ColorMap name="UTCILabels" space="RGB">
        <Point x="-99.0" o="1.0" r="0.011765" g="0.090196" b="0.564706"/>
        <Point x="-40.0" o="1.0" r="0.023529" g="0.141176" b="0.792157"/>
        <Point x="-27.0" o="1.0" r="0.035294" g="0.188235" b="0.984314"/>
        <Point x="-13.0" o="1.0" r="0.000000" g="0.474510" b="1.000000"/>
        <Point x="0.0" o="1.0" r="0.000000" g="0.792157" b="1.000000"/>
        <Point x="9.0" o="1.0" r="0.000000" g="0.772549" b="0.000000"/>
        <Point x="26.0" o="1.0" r="1.000000" g="0.568627" b="0.000000"/>
        <Point x="32.0" o="1.0" r="0.996078" g="0.152941" b="0.000000"/>
        <Point x="38.0" o="1.0" r="0.800000" g="0.113725" b="0.000000"/>
        <Point x="46.0" o="1.0" r="0.576471" g="0.066667" b="0.000000"/>
        <Point x="99.0" o="1.0" r="0.576471" g="0.066667" b="0.000000"/>
    </ColorMap>
</ColorMaps>

I am struggling as is seems that PV keeps adding datapoints in the wrong
place. Also, the band above 26 becomes one single color.
I should note that I am using the 'Color Discretization' Option with 11
colors.

Is it possible to do this? The other alternative that I see is to create an
additional output from my code with the actual labels and then use
'Interpret Values As Categories'.

Thanks
Ruggiero
_______________________________________________
Powered by www.kitware.com

Visit other Kitware open-source projects at
http://www.kitware.com/opensource/opensource.html

Please keep messages on-topic and check the ParaView Wiki at:
http://paraview.org/Wiki/ParaView

Search the list archives at: http://markmail.org/search/?q=ParaView

Follow this link to subscribe/unsubscribe:
http://public.kitware.com/mailman/listinfo/paraview