The linear correlation,  date and size of field, has been disproven.
----- Original Message -----
From: "The Buffalo In Da' Midst" <[EMAIL PROTECTED]>
To: <PEN-L@SUS.CSUCHICO.EDU>
Sent: Sunday, July 15, 2007 11:30 AM
Subject: [PEN-L] Peak (Oil) Math - In Defense of the Hubbert
Linearization Method
> Courtesy of Bill Totten @ [a-list]:
>
> by Jeffrey J Brown and "Khebab"
>
> The Oil Drum - DrumBeat (June 25 2007)
>
>
> The Hubbert Linearization (HL) method (the Hubbert Linearization term
> was coined by Stuart Staniford, with The Oil Drum) is essentially
> based on the mathematical observation that a parabolic (bell shaped)
> curve can be plotted as a line, when we plot P/Q versus Q, where P is
> annual production and Q is cumulative production to date. The
> parabolic curve assumption is based on the premise that we tend to
> find the big fields first. In essence, "Peak Oil" is the story of the
> rise and fall of the big fields.
>
> The parabolic HL model suggests that the world and Saudi Arabia are
> both probably now in terminal decline. While the overall world decline
> may be quite gradual, the impact on world oil exports will probably be
> very severe. See the following article for more information on the HL
> method: Texas and US Lower 48 Oil Production as a Model for Saudi
> Arabia and the World {1}.
>
> Note that if the Ghawar Field in Saudi Arabia is in long term decline,
> which I believe that it is, it is my understanding that every single
> field that has ever produced one million barrels per day (mbpd) or
> more of crude oil (crude + condensate) is now in decline. Saudi Arabia
> has one field coming on line that might make one mbpd, although a lot
> of people have their doubts. The only real confirmed one mbpd and
> larger field on the horizon is Kashagan, which probably won't break
> the one mbpd mark until 2020 at the earliest.
>
> As many people know, Kenneth Deffeyes predicted, using the HL method,
> a world crude oil peak between 2004 and 2008, most likely in 2005. (He
> observed that world production apparently peaked in 2000, but he never
> backed away from his mathematical model that the probable peak was
> between 2004 and 2008.)
>
> In any case, in the above referenced Texas/Lower 48 article, we
> supported Deffeyes' work, and we added the Texas model. I observed
> that Texas peaked at a later stage of depletion than the Lower 48.
> Post-peak, Texas declined at a faster rate than the overall Lower 48.
> This was the basis of my warning a year ago that the world and Saudi
> Arabia were on the verge of a decline in crude oil production. It may
> be a coincidence, but relative to monthly peaks in 2005, world crude
> oil production is down more than one percent and Saudi crude oil
> production is down about eleven percent (EIA data, crude +
> condensate).
>
> Note that the initial Lower 48 decline was quite gradual, less than
> one percent per year for the first two years. Also note that the world
> has the benefit of the non conventional tar sands production that was
> not a factor in the Lower 48.
>
> A key piece of data in support of an involuntary decline for the world
> and Saudi Arabia is the price of oil. The average monthly Brent crude
> oil price in the twenty months prior to May 2005 was $38 per barrel.
> The average monthly Brent crude oil price after May 2005 has been
> about $62, within a range of $54 to $74. Again, we saw this pattern of
> higher oil prices and lower production in the Texas and the Lower 48
> in the Seventies.
>
> The Lower 48 peaked in 1970. Based only on production through 1970,
> the Lower 48 was right at the fifty percent of Qt mark in 1970 (Qt is
> a mathematical estimate of Ultimately Recoverable Reserves for a
> region).
>
> Russia peaked on a broad plateau centered on 1984. Based only on
> production through 1984 Russia was right at the fifty percent of Qt
> mark in 1984. Russia made from just above eleven mbpd to just below
> eleven mbpd for five years on both sides of 1984.
>
> At my request, Khebab generated a post-1970 production profile for the
> Lower 48 and a post-1984 production profile for Russia, using only
> production data through 1970 for the Lower 48 and through 1984 for
> Russia to generate the models.
>
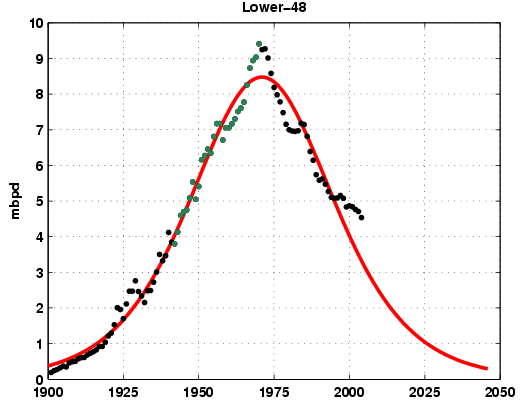
> The post-1970 cumulative Lower 48 production, through 2004, was 99% of
> what the model predicted it would be, see Figure One {2}, Hubbert
> Linearization technique applied to the Lower-48. Only the data between
> 1942 and 1970 (green points) are used to perform the fit (red curve).
>
> The post-1984 cumulative Russian production, through 2004, was 95% of
> what the model predicted it would be. In other words, Russia was
> "underproduced" through 2004, see Figure Two {3}, Hubbert
> Linearization technique applied to Russia. Only the data through 1984
> (green points) are used to perform the fit (red curve).
>
> In 2006, Russia "caught up" to where it should be. Now, as Russia has
> approached the 100% mark (100% of what it should have produced based
> on the HL model), its year over year increase in production has been
> slowing appreciably, and since October 2006, the EIA has been showing
> basically flat production for Russia.
>
> By the way, based on data through 1999 and 2005 respectively, both the
> North Sea and Mexico started declining right at their respective fifty
> percent of Qt marks.
>
> Now, a lot of claims that the HL method is inaccurate are based on a
> misuse of the method. In most cases, we don't get an accurate Qt
> estimate until we get a P/Q intercept in the five percent to ten
> percent range. For example, a lot of people use the UK as an example
> of where the HL method doesn't work, but this is based on wildly
> improbable early P/Q intercept of thirty percent.
>
> A lot of the disbelief/denial about a World/Saudi peak is very similar
> to the reaction that we saw in the Lower 48/Texas in the Seventies.
> Probably nine out of ten Texas oilmen were shocked that Texas didn't
> show increasing production after the Texas RRC went to a 100%
> allowable in 1972.
>
> But the bottom line is that we are using a fairly objective method
> that takes the two pieces data that we have the most confidence in,
> annual and cumulative production, to generate mathematical models. And
> many large producing regions - Texas; Lower 48; Total US; North Sea;
> Russia and most recently Mexico and the world - have shown production
> patterns that are consistent with the HL models.
>
> The most common response I get to all of this is simply denial. The
> reserve situation "can't be that bad".
>
> All I can tell you is what the mathematical models are telling me. In
> a nutshell, I think that the reserve situation is that bad, and I
> think that we are facing the near certainty of rapidly declining net
> export capacity worldwide.
>
> While reasonable people can disagree on what the annual and monthly
> production data are telling us about our proximity to Peak Oil, in my
> opinion it is a virtual certainty that Peak Oil, from the point of
> view of importers, is here. This virtual certainty is due to the
> absolutely lethal combination of flat to declining crude oil
> production in exporting countries and the (sometimes rapidly) rising
> domestic consumption in exporting countries, resulting in sometimes
> catastrophic declines in oil exports. For example, based on EIA data,
> net total liquids exports by the UK dropped at an annual rate of sixty
> percent per year from 2000 to 2005.
>
> In effect, in my opinion the very lifeblood of the world industrial
> economy is draining away in front of our very eyes. The only question
> is how fast the patient is bleeding to death.
>
> Sorry to be the bearer of bad news, but you wuz warned.
>
>
> Links
>
> {1}
http://graphoilogy.blogspot.com/2006/05/texas-and-us-lower-48-oil-production_25.html
>
> {2} http://static.flickr.com/43/108482206_8769d44c1c_o.png
>
> {3} http://www.theoildrum.com/files/Russia_HL_resultb.png
> _____
>
> Jeffrey Brown is an independent petroleum geologist in the Dallas,
> Texas area. His e-mail address is westexas [AT] aol.com.
>
> "Khebab" has a Masters Degree in Physics and a PhD in signal
> processing. He is currently a researcher in a computer vision lab in
> Quebec, Canada, with ten years experience in R&D.
>
> http://www.theoildrum.com/node/2689#more
>
>
> http://www.billtotten.blogspot.com http://www.ashisuto.co.jp
>