Send R-help mailing list submissions to
r-help@r-project.org
To subscribe or unsubscribe via the World Wide Web, visit
https://stat.ethz.ch/mailman/listinfo/r-help
or, via email, send a message with subject or body 'help' to
r-help-requ...@r-project.org
You can reach the person managing the list at
r-help-ow...@r-project.org
When replying, please edit your Subject line so it is more specific
than "Re: Contents of R-help digest..."
Today's Topics:
1. how can I show the xlab and ylab information while using
layout (Jie Tang)
2. Re: how can I show the xlab and ylab information while using
layout (Sarah Goslee)
3. Re: Extracting arithmetic mean for specific values from
multiple .txt-files (Rui Barradas)
4. Re: How to use external image with R plot? (Michael Sumner)
5. Re: is it possible to insert a figure into into another new
figure by r script (Thomas Adams)
6. image.plot transparent? (Chris82)
7. Re: How to add marker in Stacked bar plot? (Jorge I Velez)
8. Re: Predicted values for zero-inflated Poisson (Laura Lee)
9. Re: how can I show the xlab and ylab information while using
layout (Sarah Goslee)
10. Re: image.plot transparent? (Sarah Goslee)
11. RGB components of plot() colours ( (Ted Harding))
12. Re: number of decimal places in a number? (Martin Ivanov)
13. define stuff to be only usable in the same file
(Jessica Streicher)
14. fill 0-row data.frame with 1 line of NAs (Liviu Andronic)
15. Re: RGB components of plot() colours (Duncan Murdoch)
16. Re: define stuff to be only usable in the same file
(Duncan Murdoch)
17. Re: RGB components of plot() colours (Sarah Goslee)
18. Re: Predicted values for zero-inflated Poisson (Achim Zeileis)
19. Re: fill 0-row data.frame with 1 line of NAs (Rui Barradas)
20. Re: Plotting rpart trees with long list of class members
(Jean V Adams)
21. Re: image.plot transparent? (Prof Brian Ripley)
22. customize packages' help index ( 00index.html file )
(Damien Georges)
23. identify.hclust() doesn't cut tree at the vertical position
of the mouse pointer (WATSON Mick)
24. Use of Sappy and Tappy for Mathematical Calculation (Rantony)
25. fitting power growth (Thomas Hoffmann)
26. Mac OS X R uninstallation question (Alastair)
27. Count of elements in coulmns of a matrix (Rantony)
28. Re: Questions about doing analysis based on time (APOCooter)
29. gdata: Problem reading excel document containing non-US
characters (=?iso-8859-1?Q?Rolf_Marvin_B=F8e_Lindgren?=)
30. Re: Count of elements in coulmns of a matrix (Sarah Goslee)
31. Re: define stuff to be only usable in the same file
(Jessica Streicher)
32. Re: Mac OS X R uninstallation question (Prof Brian Ripley)
33. Re: fill 0-row data.frame with 1 line of NAs (Peter Ehlers)
34. Re: define stuff to be only usable in the same file
(Jessica Streicher)
35. estimation of NA by predict command (eliza botto)
36. Re: fill 0-row data.frame with 1 line of NAs (Brian Diggs)
37. Help with vectors and rollapply (Raghuraman Ramachandran)
38. Re: multiple comparisons with generalised least squares (Ariel)
39. RGL 3D curvilinear shapes (PatGauthier)
40. Re: estimation of NA by predict command (arun)
41. Re: Count of elements in coulmns of a matrix (arun)
42. Re: Help with vectors and rollapply (William Dunlap)
43. Re: Predicted values for zero-inflated Poisson (Laura Lee)
44. Re: Use of Sappy and Tappy for Mathematical Calculation
(Nordlund, Dan (DSHS/RDA))
45. Re: Questions about doing analysis based on time (Rui Barradas)
46. Re: Extracting arithmetic mean for specific values from
multiple .txt-files (vimmster)
47. Revolutions blog: June Roundup (David Smith)
48. calculating the difference between days? (C W)
49. Re: R to winbugs interface (Uwe Ligges)
50. Re: Predicted values for zero-inflated Poisson
(Highland Statistics Ltd)
51. Re: Extracting arithmetic mean for specific values from
multiple .txt-files (Rui Barradas)
52. Re: fill 0-row data.frame with 1 line of NAs (Peter Ehlers)
53. Re: fill 0-row data.frame with 1 line of NAs (Rui Barradas)
54. Re: Predicted values for zero-inflated Poisson (Laura Lee)
55. Re: Specify model with polynomial interaction terms up to
degree n (YTP)
56. Re: Use of Sappy and Tappy for Mathematical Calculation (arun)
57. problem for installing rgdal (stanislas rebaudet)
58. HELP me please with import of csv to R (F86)
59. R code help to change table format (peziza)
60. Re: Skipping lines and incomplete rows (arun)
61. Re: calculating the difference between days? (arun)
62. Re: estimation of NA by predict command (eliza botto)
63. Times Series Data using GLS (MRB305)
64. Need HELP: how find and use a csv file? (Faradj Koliev)
65. Re: estimation of NA by predict command (arun)
66. Changing x-axis values displayed on histogram (jlwoodard)
67. Re: Package 'MASS' (polr): Error in svd(X) : infinite or
missing values in 'x' (Rune Haubo)
68. Re: HELP me please with import of csv to R (Sarah Goslee)
69. Understanding cenros Error (Rich Shepard)
70. Re: Need HELP: how find and use a csv file? (Sarah Goslee)
71. Re: calculating the difference between days? (C W)
72. Re: Need HELP: how find and use a csv file? (Rich Shepard)
73. Re: calculating the difference between days? (C W)
74. Re: Changing x-axis values displayed on histogram (Sarah Goslee)
75. Re: Use of Sappy and Tappy for Mathematical Calculation
(R. Michael Weylandt<michael.weyla...@gmail.com>)
76. Re: calculating the difference between days? (Jorge I Velez)
77. Re: Specify model with polynomial interaction terms up to
degree n (William Dunlap)
78. Re: Changing x-axis values displayed on histogram (jlwoodard)
79. Re: R code help to change table format (Rui Barradas)
80. Re: Need HELP: how find and use a csv file?
(R. Michael Weylandt<michael.weyla...@gmail.com>)
81. Re: Need HELP: how find and use a csv file? (mlell08)
82. Re: Mann-Whitney by group (Oxenstierna)
83. Download large file from https url with progress meter
(Gregory Jefferis)
84. -1.1 - 0.1 + 1.2 is NOT null! Why? (ollestrat)
85. Re: estimation of NA by predict command (eliza botto)
86. Re: -1.1 - 0.1 + 1.2 is NOT null! Why? (Richard M. Heiberger)
87. Re: -1.1 - 0.1 + 1.2 is NOT null! Why? (William Dunlap)
----------------------------------------------------------------------
Message: 1
Date: Tue, 10 Jul 2012 18:11:53 +0800
From: Jie Tang<totang...@gmail.com>
To: r-help@r-project.org
Subject: [R] how can I show the xlab and ylab information while using
layout
Message-ID:
<camush4qcifqygmbtpqpr4tq_kmpe-q_5axrjc5tnq94gtqq...@mail.gmail.com>
Content-Type: text/plain; charset="iso-8859-1"
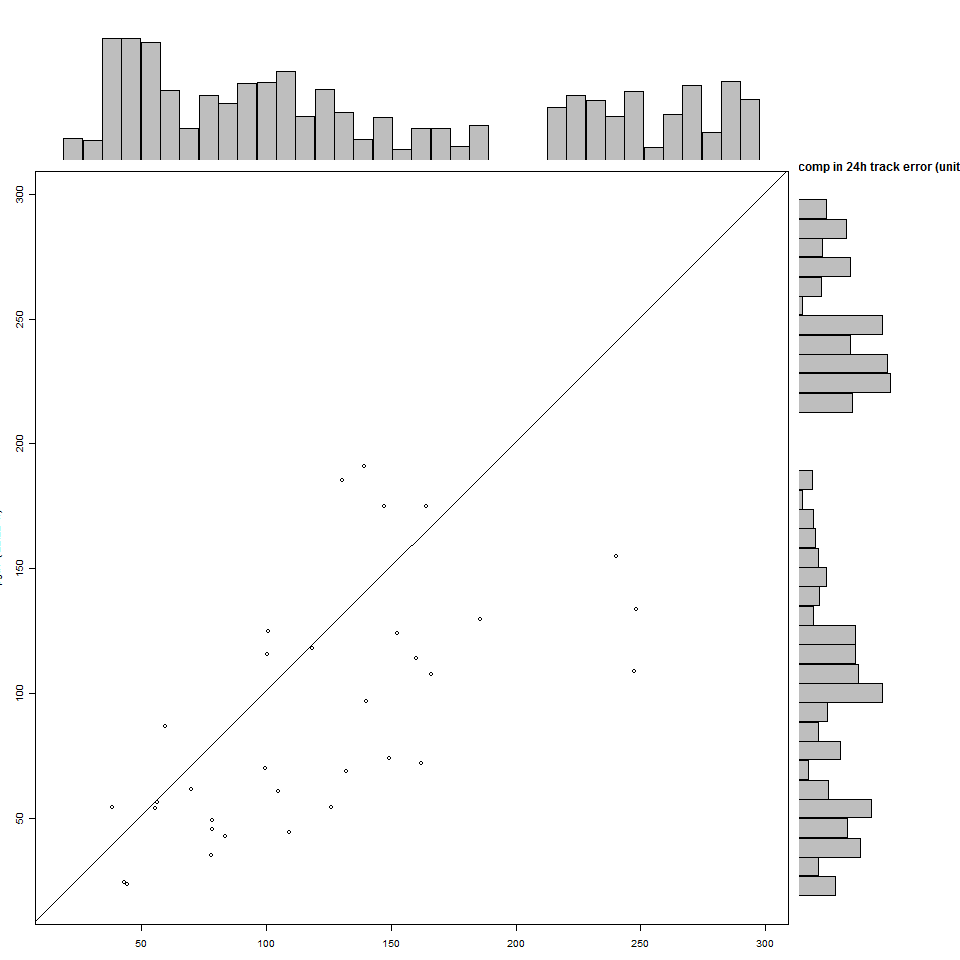
hi R-users:
I want to draw three plot into one figure by layout and the script has
been shown below.
But I find R does not show the xlab and ylab information completely as
shown the figure attached.
How can I midify the script.? thank you .
xxlab<-paste(cpmd," (",ro,"%)",sep=" ")
yylab<-paste(rfmd," (",co,"%)",sep=" ")
par(mar=c(3,3,1,1))
#layout(matrix(c(2,0,1,3),2,2,byrow=TRUE),widths=lcm(30),
heights=lcm(25),TRUE)
layout(matrix(c(2,0,1,3),2,2,byrow=TRUE),c(5,1),c(1,5),TRUE)
layout.show(3)
plot(data_cpmd,data_rfmd,xlab=xxlab,ylab=yylab,xlim=XX,ylim=YY,asp=1)
abline(1,1)
#rug(side=1,jitter(data_cpmd,5))
#rug(side=2,jitter(data_rfmd,5))
#plot(homo_ana$dism16cpmd,homo_ana$dism16rfmd,main=mtitle,xlab=xxlab,ylab=yylab,xlim=XX,ylim=YY,asp=1)
par(mar=c(0,3,1,1))
barplot(data_cpmd, axes=FALSE, ylim=YY, space=0)
par(mar=c(3,0,1,1))
barplot(data_rfmd, axes=FALSE,main=mtitle, xlim=XX, space=0, horiz=TRUE)
#boxplot(data_cpmd,horizontal = TRUE,xlim=XX,ylim=YY,outline=ifout, xaxt =
"n")
#par(mar=c(3,0,1,1))
#boxplot(data_rfmd,xlim=XX,ylim=YY,outline=ifout,yaxt = "n")
-------------- next part --------------
A non-text attachment was scrubbed...
Name: homo_jawt_pgtwhr24.png
Type: image/png
Size: 9100 bytes
Desc: not available
URL:<https://stat.ethz.ch/pipermail/r-help/attachments/20120710/754cabcd/attachment-0001.png>
------------------------------
Message: 2
Date: Tue, 10 Jul 2012 06:58:20 -0400
From: Sarah Goslee<sarah.gos...@gmail.com>
To: Jie Tang<totang...@gmail.com>, r-help<r-help@r-project.org>
Subject: Re: [R] how can I show the xlab and ylab information while
using layout
Message-ID:
<CAM_vjukwh2z2EZNhOtEkcFVpcMndKNmSuCW=jiapsfqtqdd...@mail.gmail.com>
Content-Type: text/plain
The margins you specified aren't large enough to hold the information
you're trying to put in them, so you need to make them larger.
Sarah
On Tuesday, July 10, 2012, Jie Tang wrote:
hi  R-users:
   I want to draw three plot into one figure by layout and the script has
been shown below.
  But I find R does  not show  the xlab and ylab information  completely as
shown the figure attached.
How can I midify the script.? thank you .

xxlab<-paste(cpmd," (",ro,"%)",sep=" ")
yylab<-paste(rfmd," (",co,"%)",sep=" ")
par(mar=c(3,3,1,1))
#layout(matrix(c(2,0,1,3),2,2,byrow=TRUE),widths=lcm(30),
heights=lcm(25),TRUE)
layout(matrix(c(2,0,1,3),2,2,byrow=TRUE),c(5,1),c(1,5),TRUE)
layout.show(3)
plot(data_cpmd,data_rfmd,xlab=xxlab,ylab=yylab,xlim=XX,ylim=YY,asp=1)
abline(1,1)
#rug(side=1,jitter(data_cpmd,5))
#rug(side=2,jitter(data_rfmd,5))

#plot(homo_ana$dism16cpmd,homo_ana$dism16rfmd,main=mtitle,xlab=xxlab,ylab=yylab,xlim=XX,ylim=YY,asp=1)

par(mar=c(0,3,1,1))
barplot(data_cpmd, axes=FALSE, ylim=YY, space=0)
par(mar=c(3,0,1,1))
barplot(data_rfmd, axes=FALSE,main=mtitle, xlim=XX, space=0, horiz=TRUE)

#boxplot(data_cpmd,horizontal = TRUE,xlim=XX,ylim=YY,outline=ifout, xaxt =
"n")
#par(mar=c(3,0,1,1))
#boxplot(data_rfmd,xlim=XX,ylim=YY,outline=ifout,yaxt = "n")