Hi David,

Thank you for your reply. I'm sorry if I've misconveyed my question: here it
goes again:
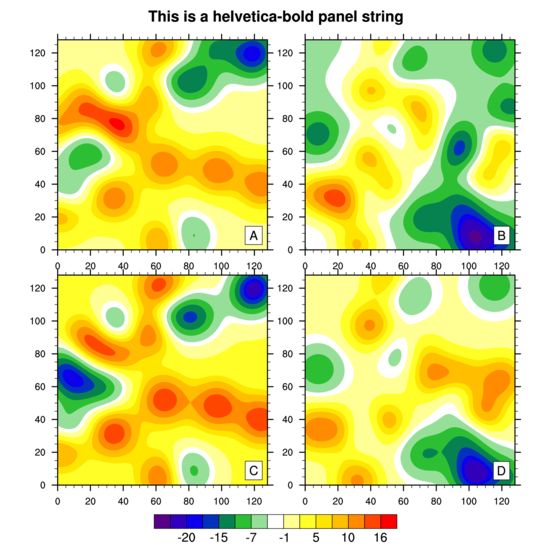
*** I want a common "main title" and a common "legend" after I
output/print four different lattice plots on a single .wmf or .pdf file***
Somewhat as in this image:

http://www.ncl.ucar.edu/Training/Workshops/Exercises/Images/panel_ex08.png

# R code:
library(lattice)
p1 <- xyplot(decrease ~ treatment, OrchardSprays, groups = rowpos,
     type = "a", main="Remove this title and legend on right",
     auto.key = list(space = "right", points = FALSE, lines = TRUE))
p2 <- xyplot(decrease ~ treatment, OrchardSprays, groups = rowpos,
     type = "a", main="Need a single / legend",
     auto.key = list(space = "right", points = FALSE, lines = TRUE))

win.metafile("Rplot%02d.wmf", width=12, height=8)
print(p1, split=c(1,1,2,2), more=TRUE)
print(p2, split=c(1,2,2,2), more=TRUE)
print(p1, split=c(2,1,2,2), more=TRUE)
print(p2, split=c(2,2,2,2))
dev.off()
Thanks,
Kim


On Thu, Mar 18, 2010 at 10:21 PM, David Winsemius <dwinsem...@comcast.net>wrote:

>
> On Mar 18, 2010, at 10:10 PM, Kim Jung Hwa wrote:
>
> Hi All,
>>
>> Can anyone please help me with getting a "single title" and "legend" for
>> both the plots in the following R code. I'll eventually be using .wmf
>> file.
>>
>
> This is either incredibly simple or you have not explained what you reall
> want. Not being on windos I would not be making a win-metafile but this pdf
> appears to be doing what you ask:
>
>  ttl <- "Some random text"
>
> p1 <- xyplot(decrease ~ treatment, OrchardSprays, groups = rowpos,
>      type = "a", main=ttl,
>
>      auto.key = list(space = "right", points = FALSE, lines = TRUE))
> p2 <- xyplot(decrease ~ treatment, OrchardSprays, groups = rowpos,
>      type = "a", main=ttl,
>
>      auto.key = list(space = "right", points = FALSE, lines = TRUE))
>
> pdf("Rplot%02d.pdf", width=12, height=8)
>
> print(p1, split=c(1,1,2,2), more=TRUE)
> print(p2, split=c(1,2,2,2), more=TRUE)
> print(p1, split=c(2,1,2,2), more=TRUE)
> print(p2, split=c(2,2,2,2))
> dev.off()
>
>
>> # R code:
>> library(lattice)
>> p1 <- xyplot(decrease ~ treatment, OrchardSprays, groups = rowpos,
>>      type = "a", main="Same title / legend",
>>      auto.key = list(space = "right", points = FALSE, lines = TRUE))
>> p2 <- xyplot(decrease ~ treatment, OrchardSprays, groups = rowpos,
>>      type = "a", main="Same title / legend",
>>      auto.key = list(space = "right", points = FALSE, lines = TRUE))
>>
>> win.metafile("Rplot%02d.wmf", width=12, height=8)
>> print(p1, split=c(1,1,2,2), more=TRUE)
>> print(p2, split=c(1,2,2,2), more=TRUE)
>> print(p1, split=c(2,1,2,2), more=TRUE)
>> print(p2, split=c(2,2,2,2))
>> dev.off()
>>
>> Thanks in advance,
>> Kim
>>
>>        [[alternative HTML version deleted]]
>>
>> ______________________________________________
>> R-help@r-project.org mailing list
>> https://stat.ethz.ch/mailman/listinfo/r-help
>> PLEASE do read the posting guide
>> http://www.R-project.org/posting-guide.html<http://www.r-project.org/posting-guide.html>
>> and provide commented, minimal, self-contained, reproducible code.
>>
>
> David Winsemius, MD
> West Hartford, CT
>
>

        [[alternative HTML version deleted]]

______________________________________________
R-help@r-project.org mailing list
https://stat.ethz.ch/mailman/listinfo/r-help
PLEASE do read the posting guide http://www.R-project.org/posting-guide.html
and provide commented, minimal, self-contained, reproducible code.