Hi David (and Others),

I think I messed it up. Lets start afresh, I do not want to use lattice for
this. I'm using multiple "plot" commands and then eventually would like to
get a *combine* x-label and y-label for this plot.
Like for example, the following plot has a combine x-label ("Height") and
one y-label ("Weight")
http://support.sas.com/documentation/cdl/en/grstateditug/61951/HTML/default/images/multi-panel-data.gif
Is it possible to get a graph similar to above one using base R only ?
# R code (this is just a sample data and not actual data I'm using)
par(mfcol=c(2,2))
plot(1:3, 4:6, type = "s", main = "", ylab="", xlab="")
plot(2:5, 5:8, type = "s", main = "", ylab="", xlab="")
plot(3:6, 6:9, type = "s", main = "", ylab="", xlab="")
plot(4:7, 6:9, type = "s", main = "", ylab="", xlab="")
Thanks in advance,
Xin
On Thu, May 13, 2010 at 1:10 PM, David Winsemius <dwinsem...@comcast.net>wrote:
>
> On May 13, 2010, at 12:59 PM, Xin Ge wrote:
>
> Hi David,
>>
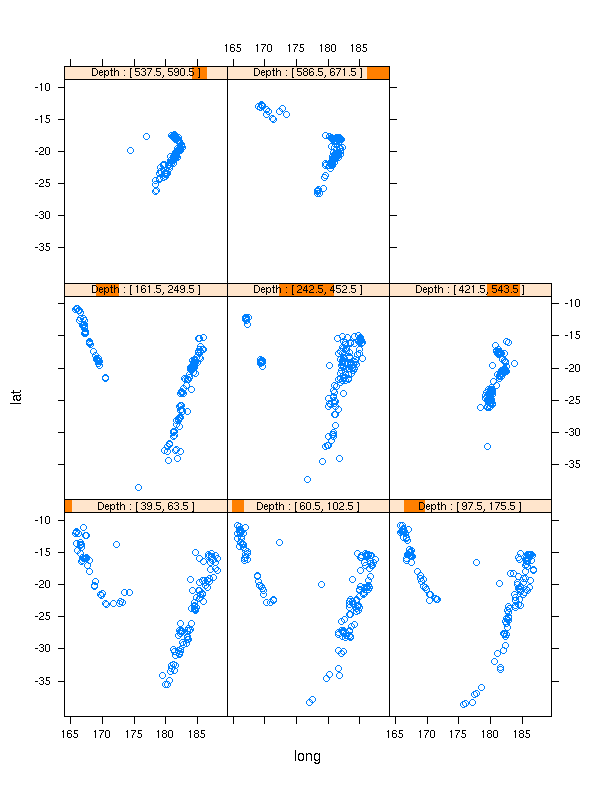
>> Thanks for your reply. By single x and y-labels I meant something like
>> this:
>>
>> http://zoonek.free.fr/blosxom//R/2006-08-10_lattice_xyplot_quakes.png
>>
>> which lattice gives by default. The code you sent doesn't seem to solve
>> the problem, I'm sorry if I havent' explained it clearly before.
>>
>> Any comments?
>>
>
> Yes. If you want lattice output, then don't use base graphics functions!!!!
>
> --
> David.
>
>
>
>> Thanks,
>> Xin
>>
>> On Thu, May 13, 2010 at 12:51 PM, David Winsemius <dwinsem...@comcast.net>
>> wrote:
>>
>> On May 13, 2010, at 12:35 PM, David Winsemius wrote:
>>
>>
>> ?plot # ylim
>>
>> and you need to have the data in a form (before plotting) where you can
>> determine the shared max and min for the y limits
>>
>> On May 13, 2010, at 12:04 PM, Xin Ge wrote:
>>
>> Hi All,
>>
>> Can anyone please help me with getting a single x and y-axis label while
>> plotting muliple plots.
>>
>> I'm still not sure what a single x-label might mean for such disparate
>> series.
>>
>> Here is the code:
>>
>> par(mfcol=c(2,2))
>> plot(x <- sort(rnorm(7)), type = "s", main = "", ylab="", xlab="")
>> plot(x <- sort(rnorm(27)), type = "s", main = "", ylab="", xlab="")
>> plot(x <- sort(rnorm(47)), type = "s", main = "", ylab="", xlab="")
>> plot(x <- sort(rnorm(67)), type = "s", main = "", ylab="", xlab="")
>>
>>
>> randlist <- list(); randlist[[1]] <- sort(rnorm(7))
>> randlist[[2]] <- sort(rnorm(27))
>> randlist[[3]] <- sort(rnorm(47))
>> randlist[[4]] <- sort(rnorm(67))
>> lapply(randlist, plot, ylim=c(min(rapply(randlist, min)),
>> max(rapply(randlist,max))),
>> type = "s", xaxt="n", main = "", ylab="", xlab="");
>> par(opar)
>>
>> A minor refinement:
>>
>>
>> opar <- par(mfcol=c(2,2))
>> lapply(randlist, plot, ylim=c(Reduce("min", randlist), Reduce("max",
>> randlist)),
>>
>> type = "s", xaxt="n", main = "", ylab="", xlab="")
>> par(opar)
>>
>>
>> also, how can remove x-tick lables using plot()?
>>
>> ?par # xaxt="n"
>>
>>
>> Thanks,
>> Xin
>>
>> [[alternative HTML version deleted]]
>>
>> ______________________________________________
>> R-help@r-project.org mailing list
>> https://stat.ethz.ch/mailman/listinfo/r-help
>> PLEASE do read the posting guide
>> http://www.R-project.org/posting-guide.html
>> and provide commented, minimal, self-contained, reproducible code.
>>
>> David Winsemius, MD
>> West Hartford, CT
>>
>>
>>
> David Winsemius, MD
> West Hartford, CT
>
>
[[alternative HTML version deleted]]
______________________________________________
R-help@r-project.org mailing list
https://stat.ethz.ch/mailman/listinfo/r-help
PLEASE do read the posting guide http://www.R-project.org/posting-guide.html
and provide commented, minimal, self-contained, reproducible code.