>>>>> "Jiantao" == Jiantao Shi <[EMAIL PROTECTED]>
>>>>>     on Mon, 7 Aug 2006 20:40:53 +0800 writes:
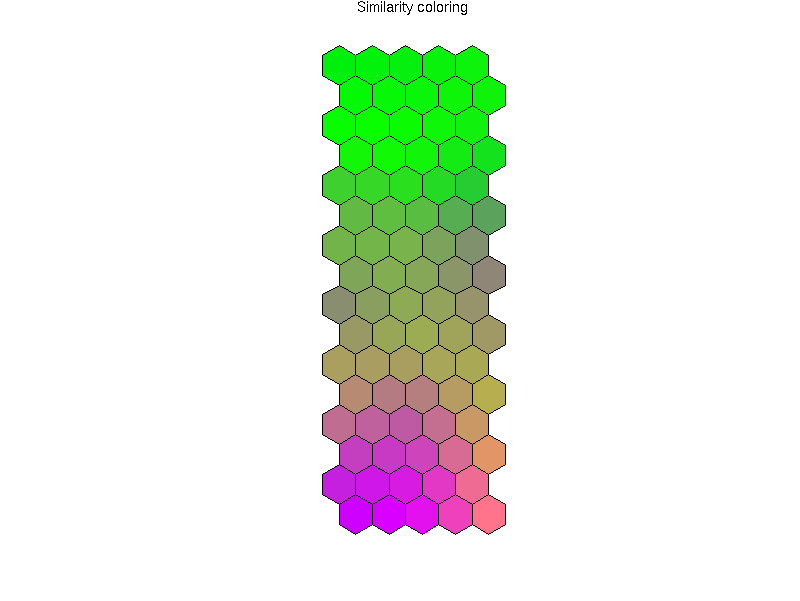
    Jiantao> This figure is the plot of prototype of a Self Organizing Maps(SOM)
    Jiantao> result.The numeric data is a M*N matrix, M rows and N
    Jiantao> columns.color2D.matplot can transform the numeric matrix to a
color matrix
    Jiantao> ,but i have to put them  in  hexagon cells to reveal their
topological
    Jiantao> structure( M  hexagon cells in a column,N  hexagon cells in a row).

    Jiantao> It seems that i have to use the GRID package in R.

yes, but only through use of the  'hexbin'  package
(part of Bioconductor, not CRAN yet) which is itself based on
using "grid".

'hexbin' does hexagon plots as you seem to want.

Martin Maechler, ETH Zurich


    Jiantao> On 8/8/06, Jim Lemon <[EMAIL PROTECTED]> wrote:
    >>
    >> Jiantao Shi wrote:
    >> > Hi,
    >> > i want to plot figure like this,
    >> >
    >>
http://www.cis.hut.fi/projects/somtoolbox/download/pics2/shotvs2_colorcode.png
    >> > So is there a function or package in R can help me to do this.
    >> >
    >> color2D.matplot transforms a numeric matrix into a color matrix, as does
    >> "image". I don't know of an R function that does hexagon cells, although
    >> it wouldn't be impossible to program. What is the numeric data behind
    >> such a plot?
    >>
    >> Jim

______________________________________________
R-help@stat.math.ethz.ch mailing list
https://stat.ethz.ch/mailman/listinfo/r-help
PLEASE do read the posting guide http://www.R-project.org/posting-guide.html
and provide commented, minimal, self-contained, reproducible code.