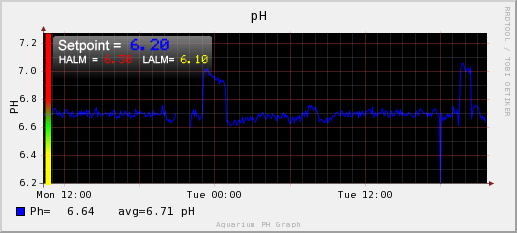
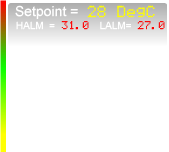
Yes you can have multiple scales...however rrdtool cannot provide the scale.
If you normalise the data so it all fits on a single y axis, i.e. normalise
everything to 0-100 %, all you then need to do is superimpose a scale onto the
rrdtrend.  DO NOT LET rrd  print the scale just the trend area.   it is quite
easy once you create a small picture (png) having the scale.
Imagemagick enables you to combine two .png files together and is a command line editor/tool for data manipulation under linux or I think windows. I run it under a SLUG and linux ubuntu. Thus you could make a complex multiscale axis and you just use imagemagick to combine the rrd graph and scale. The image below is just the rrdgraph combined with a scale to show alarm setpoint etc however theres nothing stopping you creating an alternative scale. http://img.photobucket.com/albums/v319/rjconway/rob.png This is the scale file, image magic updates this with actual data then overlays the completed scale onto the trend...and in firefox it shows its transparency http://img.photobucket.com/albums/v319/rjconway/tempscale.png I use image magic to update the header on the web page below that shows real time data above the trend areas http://smg.photobucket.com/albums/v319/rjconway/?action=view¤t=newupdate.jpg RRDTool and imagemagick and you have all the required tools to create a really nice html interface for you data Imagemagic runs under linux and the NSLU2 slug .... rob, Australia ----- Original Message ----- From: Gregory Guthrie To: [email protected] Sent: Thursday, October 04, 2007 6:08 AM Subject: [rrd-users] rrd graph - multiple graphs on one plot? I wanted to have multiple data on one graph, and also add an additional set of y-axis labels. I'd like to have wind speed and direction on one graph, and have the velocity labels as standard on the left Y-axis, but also add a direction indicator (N S E W) scale label over the scaled (0-360 => 20-30) wind direction on the right hand side of the graph. A site with a similar thing is at: http:/ / www.iwindsurf.com/windandwhere.iws?regionID=100&siteID=1399 but they use icons for direction, I wanted to just plot it as a graph. Thanks, Greg ----------------------------------------------- Gregory Guthrie MUM Faculty Mail - FM 1068 Fairfield, IA 52557 (641)472-7773 ------------------------------------------------ -------------------------------------------------------- Dr. Gregory Guthrie [EMAIL PROTECTED] (641)472-1125 Fax: -1103 Professor and Dean Computer Science Department College of Computer Science and Mathematics Maharishi University of Management http://www.mum.edu/cs_dept -------------------------------------------------------- ------------------------------------------------------------------------------ _______________________________________________ rrd-users mailing list [email protected] https://lists.oetiker.ch/cgi-bin/listinfo/rrd-users
_______________________________________________
rrd-users mailing list
[email protected]
https://lists.oetiker.ch/cgi-bin/listinfo/rrd-users