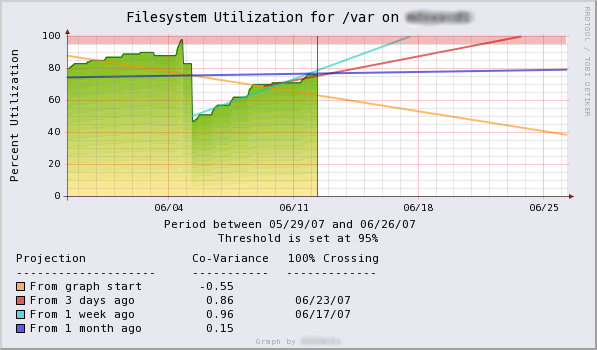
On Tue, Aug 18, 2009 at 01:43:00PM -0700, Faraaz Sareshwala wrote:

> I have drawn the hwpredict line on the graphs, some confidence bands,
> and tick data from the failures rra. However, I am looking to do
> something like what is shown in this graph on the RRDtool gallery:
> http://oss.oetiker.ch/rrdtool/gallery/fsu_predict.png. Can the
> Holt-Winters algorithm as it is implemented in RRDtool provide this
> sort of prediction? If so, can someone provide some guidance on how to
> go about doing that? If not, how is it being done in that graph?
I don't think those graphs have anything to do with holt-winters.  I'm
assuming they're simple least-squares linear fits to the data.

I tried recreating them a bit.  Haven't done anything new since this post:
<https://lists.oetiker.ch/pipermail/rrd-users/2008-March/013819.html>

Good luck.

--
Darren

_______________________________________________
rrd-users mailing list
[email protected]
https://lists.oetiker.ch/cgi-bin/listinfo/rrd-users