[GitHub] [echarts] echarts-bot[bot] commented on issue #17572: [Feature] 您好,echarts重新渲染大量数据时会发生数据重叠问题
echarts-bot[bot] commented on issue #17572:
URL: https://github.com/apache/echarts/issues/17572#issuecomment-1227014357

   @hi-mashuo It seems you are not using English, I've helped translate the
content automatically. To make your issue understood by more people and get
helped, we'd like to suggest using English next time. 🤗
   TRANSLATED

   **TITLE**

   [Feature] Hello, data overlap issues occur when echarts re-renders large
amounts of data

   **BODY**

   ### What problem does this feature solve?

   This problem has troubled me for a long time, can you give me some advice?
Thank you
   option code
   let option = {
   grid: {
 top: "2%",
 left: "5%",
 right: "4%",
 bottom: "3%",
 containLabel: true,
   },
   tooltip: {
 trigger: "axis",
 axisPointer: {
   type: "cross",
   crossStyle: {
 color: "#999",
   },
 },
   },
   xAxis: [
 {
   boundaryGap: false,
   type: "category",
   data: this.chart.x,
   axisPointer: {
 type: "shadow",
   },
   axisTick: {
 show: false,
   },
   axisLine: {
 lineStyle: {
   color: "rgba(6,199,255,.2)",
   type: "solid",
 },
   },
   axisLabel: {
 show: true,
 textStyle: {
   color: "rgba(6,199,255,.2)",
 },
   },
 },
   ],
   yAxis: [
 {
   min: Math.min(...this.chart.v),
   max: Math.max(...this.chart.v),
   type: "value",
   splitLine: {
 lineStyle: {
   color: "rgba(6,199,255,.2)",
 },
   },
   axisLine: {
 show: true,
 lineStyle: {
   color: "rgba(6,199,255,.2)",
 },
   },
   axisLabel: {
 formatter: "{value}" + this.value.split('-')[1],
 show: true,
 textStyle: {
   color: "rgba(6,199,255,.2)",
   fontWeight: "bold",
 },
   },
 },
   ],
   series: [
 {
   name: "",
   symbolSize: 10,
   itemStyle: {
 color: 'skyblue',
   },
   data: this.chart.point,
   type: 'scatter'
 },
 {
   name: "",
   type: "line",
   stack: "Total",
   smooth: true,
   lineStyle: {
 width: 2,
 color: "#06C7FF",
   },
   showSymbol: false,
   label: {
 show: true,
 position: "top",
   },
   areaStyle: {
 opacity: 0.8,
 color: new this.$echarts.graphic.LinearGradient(0, 0, 0, 1, [
   {
 offset: 0,
 color: "rgba(22,120,208,.5)",
   },
   {
 offset: 1,
 color: "rgba(22,120,208,0)",
   },
 ]),
   },
   emphasis: {
 focus: "series",
   },
   data: this.chart.v,
   markLine: {
 symbol: ["none", "none"], // remove the arrow
 itemStyle: {
   normal: {
 lineStyle: {
   type: "dashed",
   color: '#EB6100',
 },
 label: {
   show: false,
 },
   },
 },
 data: [
   {
 yAxis: this.chart.red, //The setting of false here cannot
be hidden, it can be set to -1
   },
 ],
   },
 }
   ],
 }

   ### What does the proposed API look like?

   js
   getChartData(){
 stateChart({
   end: this.timeValueNew,
   start: this.timeValueOld,
   name: this.value.split('-')[0],
   deviceId: this.info.deviceId
 }).then(res => {
   let xData = [];
   let data = [];
   let point = [];
   let data1 = res.data.data.list
   data1.map((item, index) =>{
 xData.push(item.tt)
 data.push(item.v)
 point.push([item.tt, item.v])
   })
   this.chart = {}
   this.chart = {
 x: xData,
[GitHub] [echarts] hi-mashuo opened a new issue, #17572: 您好,echarts重新渲染大量数据时会发生数据重叠问题[Feature]
hi-mashuo opened a new issue, #17572:
URL: https://github.com/apache/echarts/issues/17572

   ### What problem does this feature solve?

   这个问题困扰了我许久,可以给一些建议吗谢谢
   option代码
   let option = {
   grid: {
 top: "2%",
 left: "5%",
 right: "4%",
 bottom: "3%",
 containLabel: true,
   },
   tooltip: {
 trigger: "axis",
 axisPointer: {
   type: "cross",
   crossStyle: {
 color: "#999",
   },
 },
   },
   xAxis: [
 {
   boundaryGap: false,
   type: "category",
   data: this.chart.x,
   axisPointer: {
 type: "shadow",
   },
   axisTick: {
 show: false,
   },
   axisLine: {
 lineStyle: {
   color: "rgba(6,199,255,.2)",
   type: "solid",
 },
   },
   axisLabel: {
 show: true,
 textStyle: {
   color: "rgba(6,199,255,.2)",
 },
   },
 },
   ],
   yAxis: [
 {
   min: Math.min(...this.chart.v),
   max: Math.max(...this.chart.v),
   type: "value",
   splitLine: {
 lineStyle: {
   color: "rgba(6,199,255,.2)",
 },
   },
   axisLine: {
 show: true,
 lineStyle: {
   color: "rgba(6,199,255,.2)",
 },
   },
   axisLabel: {
 formatter: "{value}" + this.value.split('-')[1],
 show: true,
 textStyle: {
   color: "rgba(6,199,255,.2)",
   fontWeight: "bold",
 },
   },
 },
   ],
   series: [
 {
   name: "",
   symbolSize: 10,
   itemStyle: {
 color: 'skyblue',
   },
   data: this.chart.point,
   type: 'scatter'
 },
 {
   name: "",
   type: "line",
   stack: "Total",
   smooth: true,
   lineStyle: {
 width: 2,
 color: "#06C7FF",
   },
   showSymbol: false,
   label: {
 show: true,
 position: "top",
   },
   areaStyle: {
 opacity: 0.8,
 color: new this.$echarts.graphic.LinearGradient(0, 0, 0, 1, [
   {
 offset: 0,
 color: "rgba(22,120,208,.5)",
   },
   {
 offset: 1,
 color: "rgba(22,120,208,0)",
   },
 ]),
   },
   emphasis: {
 focus: "series",
   },
   data: this.chart.v,
   markLine: {
 symbol: ["none", "none"], //去掉箭头
 itemStyle: {
   normal: {
 lineStyle: {
   type: "dashed",
   color: '#EB6100',
 },
 label: {
   show: false,
 },
   },
 },
 data: [
   {
 yAxis: this.chart.red, //这里设置false是隐藏不了的,可以设置为-1
   },
 ],
   },
 }
   ],
 }

   ### What does the proposed API look like?

   js
   getChartData(){
 stateChart({
   end: this.timeValueNew,
   start: this.timeValueOld,
   name: this.value.split('-')[0],
   deviceId: this.info.deviceId
 }).then(res => {
   let xData = [];
   let data = [];
   let point = [];
   let data1 = res.data.data.list
   data1.map((item, index) =>{
 xData.push(item.tt)
 data.push(item.v)
 point.push([item.tt, item.v])
   })
   this.chart = {}
   this.chart = {
 x: xData,
 v: data,
 // red: res.data.data.lineValue,
 red: 60,
 point
   }
   this.chart.min = Math.min(...this.chart.v)
   this.chart.max = Math.max(...this.chart.v)
   this.showDom = !this.showDom
   console.log(this.showDom);
   this.myChart1()
 })
   },
   myChart1() {
const myChart1s =
this.$echarts.init(document.getElementById("myChart1"))
   let option = {
[GitHub] [echarts-doc] Ovilia commented on a diff in pull request #276: feat(graph) full path emphasis.
Ovilia commented on code in PR #276:
URL: https://github.com/apache/echarts-doc/pull/276#discussion_r954739244


##
en/api/events.md:
##
@@ -235,6 +235,59 @@ Event emitted after range is changed in visualMap.
 }
 ```


Review Comment:
   Please rebase the commit to remove the changes in other PRs.


--
This is an automated message from the Apache Git Service.
To respond to the message, please log on to GitHub and use the
URL above to go to the specific comment.

To unsubscribe, e-mail: commits-unsubscr...@echarts.apache.org

For queries about this service, please contact Infrastructure at:
us...@infra.apache.org


-
To unsubscribe, e-mail: commits-unsubscr...@echarts.apache.org
For additional commands, e-mail: commits-h...@echarts.apache.org
[GitHub] [echarts] Ovilia commented on a diff in pull request #17451: feat(graph) full path emphasis. close #17448
Ovilia commented on code in PR #17451:
URL: https://github.com/apache/echarts/pull/17451#discussion_r954746068


##
src/chart/graph/GraphSeries.ts:
##
@@ -69,7 +69,7 @@ export interface GraphNodeStateOption {


 interface ExtraEmphasisState {
-focus?: DefaultEmphasisFocus | 'adjacency'
+focus?: DefaultEmphasisFocus | 'adjacency' | 'fullPath'

Review Comment:
   Do you have other suggestions for the name of this new value? We should
avoid using two words because developers may misspell it to be `'fullpath'`.


##
src/chart/sankey/SankeyView.ts:
##
@@ -231,7 +231,9 @@ class SankeyView extends ChartView {
 const focus = emphasisModel.get('focus');
 toggleHoverEmphasis(
 curve,
-focus === 'adjacency' ? edge.getAdjacentDataIndices() : focus,
+focus === 'adjacency' ? edge.getAdjacentDataIndices()
+: focus === 'fullPath' ? edge.getFullPathDataIndices()
+: focus,

Review Comment:
   Since we are using this logic for multiple times, please consider making a
function to reuse.


##
src/data/Graph.ts:
##
@@ -387,6 +387,49 @@ class GraphNode {
 }
 return dataIndices;
 }
+
+getFullPathDataIndices(): {node: number[], edge: number[]} {
+const dataIndices = {
+edge: [] as number[],
+node: [] as number[]
+};
+
+for (let i = 0; i < this.edges.length; i++) {
+const adjacentEdge = this.edges[i];
+if (adjacentEdge.dataIndex < 0) {
+  continue;
+}
+
+dataIndices.edge.indexOf(adjacentEdge.dataIndex) === -1
+? dataIndices.edge.push(adjacentEdge.dataIndex) : null;

Review Comment:
   Use `zrUtil.indexOf` instead of `indexOf`


--
This is an automated message from the Apache Git Service.
To respond to the message, please log on to GitHub and use the
URL above to go to the specific comment.

To unsubscribe, e-mail: commits-unsubscr...@echarts.apache.org

For queries about this service, please contact Infrastructure at:
us...@infra.apache.org


-
To unsubscribe, e-mail: commits-unsubscr...@echarts.apache.org
For additional commands, e-mail: commits-h...@echarts.apache.org
[GitHub] [echarts] Ovilia closed issue #17572: [Feature] 您好,echarts重新渲染大量数据时会发生数据重叠问题
Ovilia closed issue #17572: [Feature] 您好,echarts重新渲染大量数据时会发生数据重叠问题
URL: https://github.com/apache/echarts/issues/17572


--
This is an automated message from the Apache Git Service.
To respond to the message, please log on to GitHub and use the
URL above to go to the specific comment.

To unsubscribe, e-mail: commits-unsubscr...@echarts.apache.org

For queries about this service, please contact Infrastructure at:
us...@infra.apache.org


-
To unsubscribe, e-mail: commits-unsubscr...@echarts.apache.org
For additional commands, e-mail: commits-h...@echarts.apache.org
[GitHub] [echarts] Ovilia commented on issue #17572: [Feature] 您好,echarts重新渲染大量数据时会发生数据重叠问题
Ovilia commented on issue #17572:
URL: https://github.com/apache/echarts/issues/17572#issuecomment-1227049544

   请详细描述你的问题,这个也不是 feature request 而是 bug,请选择正确的模板并按照模板要求填写内容。这个 issue
没法让别人帮助到你。


--
This is an automated message from the Apache Git Service.
To respond to the message, please log on to GitHub and use the
URL above to go to the specific comment.

To unsubscribe, e-mail: commits-unsubscr...@echarts.apache.org

For queries about this service, please contact Infrastructure at:
us...@infra.apache.org


-
To unsubscribe, e-mail: commits-unsubscr...@echarts.apache.org
For additional commands, e-mail: commits-h...@echarts.apache.org
[GitHub] [echarts] Ovilia commented on issue #17571: hope SilderDataZoom support custom cursor
Ovilia commented on issue #17571:
URL: https://github.com/apache/echarts/issues/17571#issuecomment-1227051145

   I think we can provide a new option like
[series.cursor](https://echarts.apache.org/en/option.html#series-bar.cursor).
Would you please make a pull request?


--
This is an automated message from the Apache Git Service.
To respond to the message, please log on to GitHub and use the
URL above to go to the specific comment.

To unsubscribe, e-mail: commits-unsubscr...@echarts.apache.org

For queries about this service, please contact Infrastructure at:
us...@infra.apache.org


-
To unsubscribe, e-mail: commits-unsubscr...@echarts.apache.org
For additional commands, e-mail: commits-h...@echarts.apache.org
[GitHub] [echarts] echarts-bot[bot] commented on issue #17569: In getZr() "mouseover" event is not working on indicator labels
echarts-bot[bot] commented on issue #17569:
URL: https://github.com/apache/echarts/issues/17569#issuecomment-1227052201

   @RahulVishK Please provide a demo for the issue either with [Official
Editor](https://echarts.apache.org/examples/editor.html),
[CodePen](https://codepen.io/Ovilia/pen/dyYWXWM),
[CodeSandbox](https://codesandbox.io/s/echarts-basic-example-template-mpfz1s)
or [JSFiddle](https://jsfiddle.net/plainheart/e46ozpqj/7/).


--
This is an automated message from the Apache Git Service.
To respond to the message, please log on to GitHub and use the
URL above to go to the specific comment.

To unsubscribe, e-mail: commits-unsubscr...@echarts.apache.org

For queries about this service, please contact Infrastructure at:
us...@infra.apache.org


-
To unsubscribe, e-mail: commits-unsubscr...@echarts.apache.org
For additional commands, e-mail: commits-h...@echarts.apache.org
[GitHub] [echarts] Ovilia commented on issue #17568: geo设置了selectedMode: 'single',但是鼠标快速点击多个区域,仍会选中多个区域
Ovilia commented on issue #17568:
URL: https://github.com/apache/echarts/issues/17568#issuecomment-1227055528

   可以尝试自己 debug
一下,这能帮助你尽快解决这一问题,[这里](https://github.com/apache/echarts/wiki/How-to-setup-the-dev-environment)
 是教程


--
This is an automated message from the Apache Git Service.
To respond to the message, please log on to GitHub and use the
URL above to go to the specific comment.

To unsubscribe, e-mail: commits-unsubscr...@echarts.apache.org

For queries about this service, please contact Infrastructure at:
us...@infra.apache.org


-
To unsubscribe, e-mail: commits-unsubscr...@echarts.apache.org
For additional commands, e-mail: commits-h...@echarts.apache.org
[GitHub] [echarts] Ovilia commented on issue #17567: [Feature] 象形柱图可以增加类似柱形图堆叠的功能吗?
Ovilia commented on issue #17567:
URL: https://github.com/apache/echarts/issues/17567#issuecomment-1227056567

   目前不支持,如果有需要的话欢迎提 PR
。[这里](https://github.com/apache/echarts/wiki/How-to-setup-the-dev-environment)
是教程


--
This is an automated message from the Apache Git Service.
To respond to the message, please log on to GitHub and use the
URL above to go to the specific comment.

To unsubscribe, e-mail: commits-unsubscr...@echarts.apache.org

For queries about this service, please contact Infrastructure at:
us...@infra.apache.org


-
To unsubscribe, e-mail: commits-unsubscr...@echarts.apache.org
For additional commands, e-mail: commits-h...@echarts.apache.org
[GitHub] [echarts] Ovilia commented on a diff in pull request #17461: feat(funnel): add funnel new styles #14863
Ovilia commented on code in PR #17461:
URL: https://github.com/apache/echarts/pull/17461#discussion_r954782704


##
src/chart/funnel/FunnelSeries.ts:
##
@@ -94,7 +94,15 @@ export interface FunnelSeriesOption

 funnelAlign?: HorizontalAlign | VerticalAlign

+exitShape?: 'rect' | 'none'
+
 data?: (OptionDataValueNumeric | OptionDataValueNumeric[] |
FunnelDataItemOption)[]
+
+dynamicHeight?: boolean
+
+exitWidth?: string

Review Comment:
   I read the description again and I found that I misunderstood the concept of
`exitWidth` completely. I think this is a useful feature but a better name is
required to let the developers understand this is for the overall funnel rather
than the last one because the *exist* suggest it to be the last one.


--
This is an automated message from the Apache Git Service.
To respond to the message, please log on to GitHub and use the
URL above to go to the specific comment.

To unsubscribe, e-mail: commits-unsubscr...@echarts.apache.org

For queries about this service, please contact Infrastructure at:
us...@infra.apache.org


-
To unsubscribe, e-mail: commits-unsubscr...@echarts.apache.org
For additional commands, e-mail: commits-h...@echarts.apache.org
[GitHub] [echarts] Ovilia commented on a diff in pull request #17461: feat(funnel): add funnel new styles #14863
Ovilia commented on code in PR #17461:
URL: https://github.com/apache/echarts/pull/17461#discussion_r954783545


##
src/chart/funnel/FunnelView.ts:
##
@@ -167,8 +169,141 @@ class FunnelPiece extends graphic.Polygon {
 stroke: visualColor
 });
 }
+
+ratePiece: RatePiece;
 }

+class RatePiece extends graphic.Polygon {
+
+constructor(data: SeriesData, idx: number) {
+super();
+
+const polygon = this;
+const labelLine = new graphic.Polyline();
+const text = new graphic.Text();
+polygon.setTextContent(text);
+this.setTextGuideLine(labelLine);
+
+this.updateData(data, idx, true);
+}
+updateData(data: SeriesData, idx: number, firstCreate?: boolean) {
+const polygon = this;
+const layout = data.getItemLayout(idx);
+const seriesModel = data.hostModel;
+let opacity: number;
+if (layout.isLastPiece) {
+opacity = 1;
+}
+else {
+opacity = 0.5;
+}
+
+if (!firstCreate) {
+saveOldStyle(polygon);
+}
+
+if (layout.isLastPiece) {
+polygon.useStyle(Object.assign(data.getItemVisual(idx, 'style'), {
fill: 'rgba(0,0,0,0)' }));

Review Comment:
   You can probably use `'none'`.


--
This is an automated message from the Apache Git Service.
To respond to the message, please log on to GitHub and use the
URL above to go to the specific comment.

To unsubscribe, e-mail: commits-unsubscr...@echarts.apache.org

For queries about this service, please contact Infrastructure at:
us...@infra.apache.org


-
To unsubscribe, e-mail: commits-unsubscr...@echarts.apache.org
For additional commands, e-mail: commits-h...@echarts.apache.org
[GitHub] [echarts] Ovilia commented on pull request #17461: feat(funnel): add funnel new styles #14863
Ovilia commented on PR #17461:
URL: https://github.com/apache/echarts/pull/17461#issuecomment-1227070055

   To be honest, I don't like the idea of `dynamicHeight` from the perspect of
data visualization because it may cause much misunderstanding. But I understand
this may be a common requirement so we can provide this option.

   But `dynamicHeight` is not a good name because it does not tell how it works
with *dynamic*. From the description, I understand that the height is relative
to the data. So we should probably present this information in the name.

   #17566 suggests using the area of the shapes to represent the data. Although
you don't have to implement this feature in your PR, you should probably better
design the API to make that feature possible in future PRs.

   > FYI, pie series use
[roseType](https://echarts.apache.org/en/option.html#series-pie.roseType),
although I'm not sure if this is useful.


--
This is an automated message from the Apache Git Service.
To respond to the message, please log on to GitHub and use the
URL above to go to the specific comment.

To unsubscribe, e-mail: commits-unsubscr...@echarts.apache.org

For queries about this service, please contact Infrastructure at:
us...@infra.apache.org


-
To unsubscribe, e-mail: commits-unsubscr...@echarts.apache.org
For additional commands, e-mail: commits-h...@echarts.apache.org
[GitHub] [echarts] Ovilia commented on issue #17565: [Feature] set some nodes above others in a force graph
Ovilia commented on issue #17565:
URL: https://github.com/apache/echarts/issues/17565#issuecomment-1227077637

   I can't think a way to do that. Usually you can use an extra series with a
bigger `z` to do this, but the force graph doesn't work this this plan.


--
This is an automated message from the Apache Git Service.
To respond to the message, please log on to GitHub and use the
URL above to go to the specific comment.

To unsubscribe, e-mail: commits-unsubscr...@echarts.apache.org

For queries about this service, please contact Infrastructure at:
us...@infra.apache.org


-
To unsubscribe, e-mail: commits-unsubscr...@echarts.apache.org
For additional commands, e-mail: commits-h...@echarts.apache.org
[GitHub] [echarts] echarts-bot[bot] commented on issue #17563: [Bug] Heatmap视图下,markArea无法同时设定X值和Y值。
echarts-bot[bot] commented on issue #17563:
URL: https://github.com/apache/echarts/issues/17563#issuecomment-1227078688

   @Knell0714 Please provide a demo for the issue either with [Official
Editor](https://echarts.apache.org/examples/editor.html),
[CodePen](https://codepen.io/Ovilia/pen/dyYWXWM),
[CodeSandbox](https://codesandbox.io/s/echarts-basic-example-template-mpfz1s)
or [JSFiddle](https://jsfiddle.net/plainheart/e46ozpqj/7/).


--
This is an automated message from the Apache Git Service.
To respond to the message, please log on to GitHub and use the
URL above to go to the specific comment.

To unsubscribe, e-mail: commits-unsubscr...@echarts.apache.org

For queries about this service, please contact Infrastructure at:
us...@infra.apache.org


-
To unsubscribe, e-mail: commits-unsubscr...@echarts.apache.org
For additional commands, e-mail: commits-h...@echarts.apache.org
[GitHub] [echarts] Ovilia commented on issue #17563: [Bug] Heatmap视图下,markArea无法同时设定X值和Y值。
Ovilia commented on issue #17563:
URL: https://github.com/apache/echarts/issues/17563#issuecomment-1227079244

   如果是想要画矩形的话可以直接用
[graphic.element-rect](https://echarts.apache.org/en/option.html#graphic.elements-rect)


--
This is an automated message from the Apache Git Service.
To respond to the message, please log on to GitHub and use the
URL above to go to the specific comment.

To unsubscribe, e-mail: commits-unsubscr...@echarts.apache.org

For queries about this service, please contact Infrastructure at:
us...@infra.apache.org


-
To unsubscribe, e-mail: commits-unsubscr...@echarts.apache.org
For additional commands, e-mail: commits-h...@echarts.apache.org
[GitHub] [echarts] Ovilia commented on issue #17561: [Bug] CallbackDataParams type doesn't have axisValue, axisValueLabel properties
Ovilia commented on issue #17561:
URL: https://github.com/apache/echarts/issues/17561#issuecomment-1227088123

   I can see `axisValue`, `axisValueLabel` in the console.

   https://user-images.githubusercontent.com/779050/186644062-7c83ab38-c210-440b-881f-4feb2d9edb26.png";>


   How to reproduce?


--
This is an automated message from the Apache Git Service.
To respond to the message, please log on to GitHub and use the
URL above to go to the specific comment.

To unsubscribe, e-mail: commits-unsubscr...@echarts.apache.org

For queries about this service, please contact Infrastructure at:
us...@infra.apache.org


-
To unsubscribe, e-mail: commits-unsubscr...@echarts.apache.org
For additional commands, e-mail: commits-h...@echarts.apache.org
[GitHub] [echarts] Ovilia commented on issue #17555: getModel support for radar chart indicator labels and axisLabel
Ovilia commented on issue #17555:
URL: https://github.com/apache/echarts/issues/17555#issuecomment-1227092139

   Yes. Can you be more specific about what you want? You can use
[graphic](https://echarts.apache.org/en/option.html#graphic) to draw.


--
This is an automated message from the Apache Git Service.
To respond to the message, please log on to GitHub and use the
URL above to go to the specific comment.

To unsubscribe, e-mail: commits-unsubscr...@echarts.apache.org

For queries about this service, please contact Infrastructure at:
us...@infra.apache.org


-
To unsubscribe, e-mail: commits-unsubscr...@echarts.apache.org
For additional commands, e-mail: commits-h...@echarts.apache.org
[GitHub] [echarts] manojkannekanti commented on issue #17561: [Bug] CallbackDataParams type doesn't have axisValue, axisValueLabel properties
manojkannekanti commented on issue #17561:
URL: https://github.com/apache/echarts/issues/17561#issuecomment-1227109811

   >

   I am saying in the type definition I am not seeing those properties which is
giving me typescript error. I am pointing to CallbackDataParams type? do I need
to refer to a different data type?


--
This is an automated message from the Apache Git Service.
To respond to the message, please log on to GitHub and use the
URL above to go to the specific comment.

To unsubscribe, e-mail: commits-unsubscr...@echarts.apache.org

For queries about this service, please contact Infrastructure at:
us...@infra.apache.org


-
To unsubscribe, e-mail: commits-unsubscr...@echarts.apache.org
For additional commands, e-mail: commits-h...@echarts.apache.org
[GitHub] [echarts] noce2 commented on issue #17230: [Bug] Stacking doesn't work properly when using X axis type "time"
noce2 commented on issue #17230:
URL: https://github.com/apache/echarts/issues/17230#issuecomment-1227158768

   @jiawulin001 could you/some else point me at a place where I could make a
start on a solution for this?


--
This is an automated message from the Apache Git Service.
To respond to the message, please log on to GitHub and use the
URL above to go to the specific comment.

To unsubscribe, e-mail: commits-unsubscr...@echarts.apache.org

For queries about this service, please contact Infrastructure at:
us...@infra.apache.org


-
To unsubscribe, e-mail: commits-unsubscr...@echarts.apache.org
For additional commands, e-mail: commits-h...@echarts.apache.org
[GitHub] [echarts] im-what-im commented on issue #12390: Add week number support for calendar chart
im-what-im commented on issue #12390:
URL: https://github.com/apache/echarts/issues/12390#issuecomment-1227294281

   +1


--
This is an automated message from the Apache Git Service.
To respond to the message, please log on to GitHub and use the
URL above to go to the specific comment.

To unsubscribe, e-mail: commits-unsubscr...@echarts.apache.org

For queries about this service, please contact Infrastructure at:
us...@infra.apache.org


-
To unsubscribe, e-mail: commits-unsubscr...@echarts.apache.org
For additional commands, e-mail: commits-h...@echarts.apache.org
[GitHub] [echarts] hauserkristof commented on issue #14253: Echarts Tooltip display issue when html body is using css property zoom: 0.5
hauserkristof commented on issue #14253:
URL: https://github.com/apache/echarts/issues/14253#issuecomment-1227587113

   +1


--
This is an automated message from the Apache Git Service.
To respond to the message, please log on to GitHub and use the
URL above to go to the specific comment.

To unsubscribe, e-mail: commits-unsubscr...@echarts.apache.org

For queries about this service, please contact Infrastructure at:
us...@infra.apache.org


-
To unsubscribe, e-mail: commits-unsubscr...@echarts.apache.org
For additional commands, e-mail: commits-h...@echarts.apache.org
[GitHub] [echarts] hauserkristof commented on issue #15103: browser zoom and dom zoom will cause mouse position fault in tooltip
hauserkristof commented on issue #15103:
URL: https://github.com/apache/echarts/issues/15103#issuecomment-1227587728

   +1


--
This is an automated message from the Apache Git Service.
To respond to the message, please log on to GitHub and use the
URL above to go to the specific comment.

To unsubscribe, e-mail: commits-unsubscr...@echarts.apache.org

For queries about this service, please contact Infrastructure at:
us...@infra.apache.org


-
To unsubscribe, e-mail: commits-unsubscr...@echarts.apache.org
For additional commands, e-mail: commits-h...@echarts.apache.org
[GitHub] [echarts] github-actions[bot] commented on issue #5546: axisPointer:{type:"cross"}横线如何吸附在线图上
github-actions[bot] commented on issue #5546:
URL: https://github.com/apache/echarts/issues/5546#issuecomment-1227761443

   This issue has been automatically closed because it did not have recent
activity. If this remains to be a problem with the latest version of Apache
ECharts, please open a new issue and link this to it. Thanks!


--
This is an automated message from the Apache Git Service.
To respond to the message, please log on to GitHub and use the
URL above to go to the specific comment.

To unsubscribe, e-mail: commits-unsubscr...@echarts.apache.org

For queries about this service, please contact Infrastructure at:
us...@infra.apache.org


-
To unsubscribe, e-mail: commits-unsubscr...@echarts.apache.org
For additional commands, e-mail: commits-h...@echarts.apache.org
[GitHub] [echarts] github-actions[bot] commented on issue #13115: 漏斗图funnel-customize 焦点切换问题
github-actions[bot] commented on issue #13115:
URL: https://github.com/apache/echarts/issues/13115#issuecomment-1227761578

   This issue has been automatically marked as stale because it did not have
recent activity. It will be closed in 7 days if no further activity occurs. If
you wish not to mark it as stale, please leave a comment in this issue.


--
This is an automated message from the Apache Git Service.
To respond to the message, please log on to GitHub and use the
URL above to go to the specific comment.

To unsubscribe, e-mail: commits-unsubscr...@echarts.apache.org

For queries about this service, please contact Infrastructure at:
us...@infra.apache.org


-
To unsubscribe, e-mail: commits-unsubscr...@echarts.apache.org
For additional commands, e-mail: commits-h...@echarts.apache.org
[GitHub] [echarts] github-actions[bot] closed issue #5546: axisPointer:{type:"cross"}横线如何吸附在线图上
github-actions[bot] closed issue #5546: axisPointer:{type:"cross"}横线如何吸附在线图上
URL: https://github.com/apache/echarts/issues/5546


--
This is an automated message from the Apache Git Service.
To respond to the message, please log on to GitHub and use the
URL above to go to the specific comment.

To unsubscribe, e-mail: commits-unsubscr...@echarts.apache.org

For queries about this service, please contact Infrastructure at:
us...@infra.apache.org


-
To unsubscribe, e-mail: commits-unsubscr...@echarts.apache.org
For additional commands, e-mail: commits-h...@echarts.apache.org
[GitHub] [echarts] github-actions[bot] commented on issue #13176: 微信小程序tooltip.extraCssText参数无效
github-actions[bot] commented on issue #13176:
URL: https://github.com/apache/echarts/issues/13176#issuecomment-1227761703

   This issue has been automatically marked as stale because it did not have
recent activity. It will be closed in 7 days if no further activity occurs. If
you wish not to mark it as stale, please leave a comment in this issue.


--
This is an automated message from the Apache Git Service.
To respond to the message, please log on to GitHub and use the
URL above to go to the specific comment.

To unsubscribe, e-mail: commits-unsubscr...@echarts.apache.org

For queries about this service, please contact Infrastructure at:
us...@infra.apache.org


-
To unsubscribe, e-mail: commits-unsubscr...@echarts.apache.org
For additional commands, e-mail: commits-h...@echarts.apache.org
[GitHub] [echarts] github-actions[bot] commented on issue #13179: in gauge,value don't display 5.00
github-actions[bot] commented on issue #13179:
URL: https://github.com/apache/echarts/issues/13179#issuecomment-1227761795

   This issue has been automatically marked as stale because it did not have
recent activity. It will be closed in 7 days if no further activity occurs. If
you wish not to mark it as stale, please leave a comment in this issue.


--
This is an automated message from the Apache Git Service.
To respond to the message, please log on to GitHub and use the
URL above to go to the specific comment.

To unsubscribe, e-mail: commits-unsubscr...@echarts.apache.org

For queries about this service, please contact Infrastructure at:
us...@infra.apache.org


-
To unsubscribe, e-mail: commits-unsubscr...@echarts.apache.org
For additional commands, e-mail: commits-h...@echarts.apache.org
[GitHub] [echarts] github-actions[bot] commented on issue #13177: series-lines - axis auto scaling
github-actions[bot] commented on issue #13177:
URL: https://github.com/apache/echarts/issues/13177#issuecomment-1227761753

   This issue has been automatically marked as stale because it did not have
recent activity. It will be closed in 7 days if no further activity occurs. If
you wish not to mark it as stale, please leave a comment in this issue.


--
This is an automated message from the Apache Git Service.
To respond to the message, please log on to GitHub and use the
URL above to go to the specific comment.

To unsubscribe, e-mail: commits-unsubscr...@echarts.apache.org

For queries about this service, please contact Infrastructure at:
us...@infra.apache.org


-
To unsubscribe, e-mail: commits-unsubscr...@echarts.apache.org
For additional commands, e-mail: commits-h...@echarts.apache.org
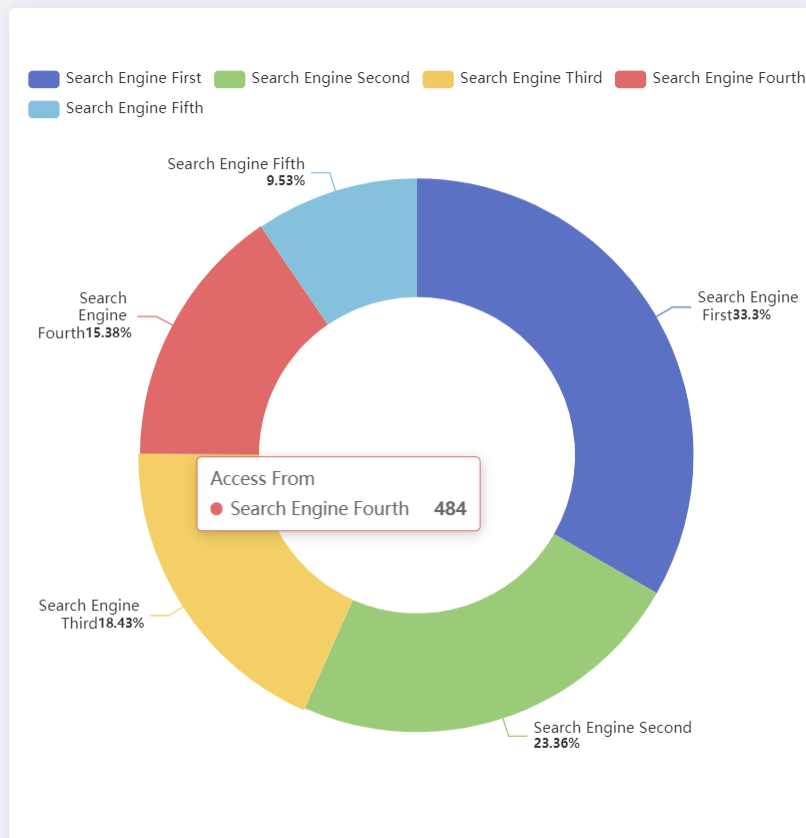
[GitHub] [echarts] robert-rouse opened a new issue, #17573: [Bug] overflow:'break' on Pie Chart label not working as expected
robert-rouse opened a new issue, #17573:
URL: https://github.com/apache/echarts/issues/17573
### Version
5.3.3
### Link to Minimal Reproduction
_No response_
### Steps to Reproduce
Enter the following data on the echarts example here:
https://echarts.apache.org/examples/en/editor.html?c=pie-doughnut
```
option = {
tooltip: {
trigger: 'item'
},
legend: {
top: '5%',
left: 'center'
},
series: [
{
name: 'Access From',
type: 'pie',
radius: ['40%', '70%'],
avoidLabelOverlap: true,
label: {
show: true,
position: 'outer',
overflow: 'break',
formatter: [
'{b}',
'{d}%'
// '{label|{b}}',
// '{percent|{d}%}'
].join('\n'),
// rich: {
// percent: {
// fontSize: 10,
// fontWeight: 'bold',
// lineHeight: 12,
// },
// label: {
// fontSize: 12,
// lineHeight: 14,
// }
// },
},
emphasis: {
label: {
show: true,
fontSize: '30',
fontWeight: 'bold'
}
},
labelLine: {
show: true
},
data: [
{ value: 1048, name: 'Search Engine First' },
{ value: 735, name: 'Search Engine Second' },
{ value: 580, name: 'Search Engine Third' },
{ value: 484, name: 'Search Engine Fourth' },
{ value: 300, name: 'Search Engine Fifth' }
]
}
]
};
```
Adjust the width of the render/preview window until the labels don't fit on
the same line
### Current Behavior
### Problem 1
Using the example above with the richtext options commented, the labels wrap
on word pretty much as expected
i.e.
```
formatter: [
'{b}',
'{d}%'
].join('\n'),
// rich: {
// percent: {
// fontSize: 10,
// fontWeight: 'bold',
// lineHeight: 12,
// },
// label: {
// fontSize: 12,
// lineHeight: 14,
// }
// },
```

When you use richtext however, the linebreaks setup in the formatter are not
honored.
i.e.
```
formatter: [
// '{b}',
// '{d}%'
'{label|{b}}',
'{percent|{d}%}'
].join('\n'),
rich: {
percent: {
fontSize: 10,
fontWeight: 'bold',
lineHeight: 12,
},
label: {
fontSize: 12,
lineHeight: 14,
}
},
},
```
### Problem 2
Long words render poorly with overflow:'break'
Changing the data to:
```
{ value: 1048, name: 'ThisIsALongName and ThisIsALongName' },
{ value: 735, name: 'ThisIsALongName and ThisIsALongName' },
{ value: 580, name: 'ThisIsALongName and ThisIsALongName' },
{ value: 484, name: 'ThisIsALongName and ThisIsALongName' },
{ value: 300, name: 'ThisIsALongName and ThisIsALongName' }
```

### Expected Behavior
### Problem 1
Newlines should be honored when using richtext and overflow:'break'
### Problem 2
There are probably several ways this could be improved and I'd be open to
suggestions, but it certainly doesn't look right as it is. In an ideal world,
the label's position would adjust automatically to not need to overflow in the
middle of a word. Another option could be to truncate with ellipsis per line,
if breaking on word is impossible.
### Environment
```markdown
- OS: Windows WSL
- Browser: Chrome 101.0.4951.64
- Framework: Vue2 and Vue3
```
### Any additional comments?
I've seen a couple other tickets opened about this, but they've been closed
for the reporters not responding, but it seems to have been an issue for a
while now
--
This is an automated message from the Apache Git Service.
To respond to the message, please log on to GitHub and use the
URL above to go to the specific comment.
To unsubscribe, e-mail: commits-unsubscr...@echarts.apache.org.apache.org
For queries about this service, please contact Infrastructure at:
us...@infra.apache.org
-
[GitHub] [echarts] Ovilia merged pull request #17551: fix(theme): fix tooltips text style of the theme macarons
Ovilia merged PR #17551:
URL: https://github.com/apache/echarts/pull/17551


--
This is an automated message from the Apache Git Service.
To respond to the message, please log on to GitHub and use the
URL above to go to the specific comment.

To unsubscribe, e-mail: commits-unsubscr...@echarts.apache.org

For queries about this service, please contact Infrastructure at:
us...@infra.apache.org


-
To unsubscribe, e-mail: commits-unsubscr...@echarts.apache.org
For additional commands, e-mail: commits-h...@echarts.apache.org
[GitHub] [echarts] echarts-bot[bot] commented on pull request #17551: fix(theme): fix tooltips text style of the theme macarons
echarts-bot[bot] commented on PR #17551:
URL: https://github.com/apache/echarts/pull/17551#issuecomment-1227978822

   Congratulations! Your PR has been merged. Thanks for your contribution! 👍


--
This is an automated message from the Apache Git Service.
To respond to the message, please log on to GitHub and use the
URL above to go to the specific comment.

To unsubscribe, e-mail: commits-unsubscr...@echarts.apache.org

For queries about this service, please contact Infrastructure at:
us...@infra.apache.org


-
To unsubscribe, e-mail: commits-unsubscr...@echarts.apache.org
For additional commands, e-mail: commits-h...@echarts.apache.org
[echarts] branch master updated: fix(theme): fix tooltips text style of the theme macarons
This is an automated email from the ASF dual-hosted git repository.

ovilia pushed a commit to branch master
in repository https://gitbox.apache.org/repos/asf/echarts.git


The following commit(s) were added to refs/heads/master by this push:
 new 204f7a836 fix(theme): fix tooltips text style of the theme macarons
 new 71e954886 Merge pull request #17551 from mousne/master
204f7a836 is described below

commit 204f7a83656c446ab85d59b81c65aec151846abc
Author: mousne
AuthorDate: Tue Aug 23 10:20:53 2022 +0800

fix(theme): fix tooltips text style of the theme macarons
---
 theme/macarons.js | 4
 1 file changed, 4 insertions(+)

diff --git a/theme/macarons.js b/theme/macarons.js
index c771d5e84..27c9f9a38 100644
--- a/theme/macarons.js
+++ b/theme/macarons.js
@@ -87,7 +87,11 @@
 },

 tooltip: {
+borderWidth: 0,
 backgroundColor: 'rgba(50,50,50,0.5)',
+textStyle: {
+color: '#FFF'
+},
 axisPointer: {
 type: 'line',
 lineStyle: {


-
To unsubscribe, e-mail: commits-unsubscr...@echarts.apache.org
For additional commands, e-mail: commits-h...@echarts.apache.org
[GitHub] [echarts] weihaopeng commented on issue #17564: [Feature] Highlight a line using dispatchAction 'highlight'
weihaopeng commented on issue #17564:
URL: https://github.com/apache/echarts/issues/17564#issuecomment-1228006990
I found this in the test file.

I tried `chart.dispatchAction({type: 'highlight',dataIndex:
[0,1,2,3],dataType:'edge'})`. It worked. Plz add this to your doc.
--
This is an automated message from the Apache Git Service.
To respond to the message, please log on to GitHub and use the
URL above to go to the specific comment.
To unsubscribe, e-mail: commits-unsubscr...@echarts.apache.org
For queries about this service, please contact Infrastructure at:
us...@infra.apache.org
-
To unsubscribe, e-mail: commits-unsubscr...@echarts.apache.org
For additional commands, e-mail: commits-h...@echarts.apache.org
[GitHub] [echarts] weihaopeng commented on issue #17564: [Feature] Highlight a line using dispatchAction 'highlight'
weihaopeng commented on issue #17564:
URL: https://github.com/apache/echarts/issues/17564#issuecomment-1228008359

   Also, I found that if I use two highlight function at the same time, e.g. :
   ```
   chart.dispatchAction({type: 'highlight',dataIndex: [0,1],dataType:'edge'})
   chart.dispatchAction({type: 'highlight',dataIndex: [0,1,2,3]}) // node
   ```
   The node highlight func will downplay the lines' highlight, then highlight
nodes. I don't think it's right. With this, I cannot highlight multiple nodes
and lines in the same time.(Cannot write them in a function, too.)


--
This is an automated message from the Apache Git Service.
To respond to the message, please log on to GitHub and use the
URL above to go to the specific comment.

To unsubscribe, e-mail: commits-unsubscr...@echarts.apache.org

For queries about this service, please contact Infrastructure at:
us...@infra.apache.org


-
To unsubscribe, e-mail: commits-unsubscr...@echarts.apache.org
For additional commands, e-mail: commits-h...@echarts.apache.org
[GitHub] [echarts] loufangjin-cpu opened a new issue, #17574: type: 'tree' 树形结构点击展开收起, 如何拿到整棵树哪些节点是展开状态,哪些节点是收起状态
loufangjin-cpu opened a new issue, #17574:
URL: https://github.com/apache/echarts/issues/17574

   ### What problem does this feature solve?

   期待点击展开收起的时候, 能拿到整棵树节点 , 哪些是展开和收起的状态。 便于动态获取树节点的最大高度

   ### What does the proposed API look like?

   展开树节点,每一层级会计算一个高度, 但是收起的时候,点击第二层级, 拿到的是点三层级的高度


--
This is an automated message from the Apache Git Service.
To respond to the message, please log on to GitHub and use the
URL above to go to the specific comment.

To unsubscribe, e-mail: commits-unsubscr...@echarts.apache.org.apache.org

For queries about this service, please contact Infrastructure at:
us...@infra.apache.org


-
To unsubscribe, e-mail: commits-unsubscr...@echarts.apache.org
For additional commands, e-mail: commits-h...@echarts.apache.org
[GitHub] [echarts] echarts-bot[bot] commented on issue #17574: type: 'tree' 树形结构点击展开收起, 如何拿到整棵树哪些节点是展开状态,哪些节点是收起状态
echarts-bot[bot] commented on issue #17574:
URL: https://github.com/apache/echarts/issues/17574#issuecomment-1228012697

   @loufangjin-cpu It seems you are not using English, I've helped translate
the content automatically. To make your issue understood by more people and get
helped, we'd like to suggest using English next time. 🤗
   TRANSLATED

   **TITLE**

   type: 'tree' tree structure click to expand and collapse, how to get the
entire tree which nodes are in the expanded state and which nodes are in the
collapsed state

   **BODY**

   ### What problem does this feature solve?

   Looking forward to clicking on the expand and collapse, you can get the
whole tree node, which are the states of expansion and collapse. Facilitates
dynamic acquisition of the maximum height of tree nodes

   ### What does the proposed API look like?

   Expand the tree node, each level will calculate a height, but when you put
it away, click on the second level, and you get the height of the third level


--
This is an automated message from the Apache Git Service.
To respond to the message, please log on to GitHub and use the
URL above to go to the specific comment.

To unsubscribe, e-mail: commits-unsubscr...@echarts.apache.org

For queries about this service, please contact Infrastructure at:
us...@infra.apache.org


-
To unsubscribe, e-mail: commits-unsubscr...@echarts.apache.org
For additional commands, e-mail: commits-h...@echarts.apache.org
[GitHub] [echarts] TT527 opened a new issue, #17575: [Bug] Scale graph lines are not aligned in SVG
TT527 opened a new issue, #17575: URL: https://github.com/apache/echarts/issues/17575 ### Version 5.3.3 ### Link to Minimal Reproduction https://codesandbox.io/s/peaceful-nova-qtorhn?file=/src/index.js ### Steps to Reproduce zoom min graph ### Current Behavior 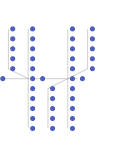 No alignment when zooming ### Expected Behavior 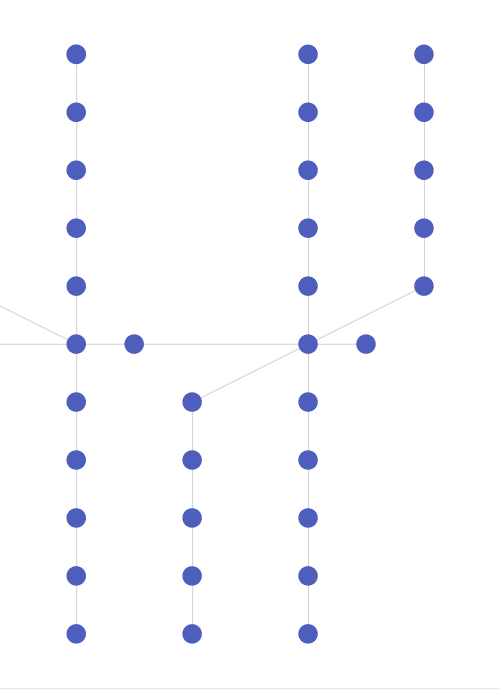 ### Environment ```markdown - OS:macOS Monterey - Browser:Edge 104.0.1293.63 - Framework: ``` ### Any additional comments? _No response_ -- This is an automated message from the Apache Git Service. To respond to the message, please log on to GitHub and use the URL above to go to the specific comment. To unsubscribe, e-mail: commits-unsubscr...@echarts.apache.org.apache.org For queries about this service, please contact Infrastructure at: us...@infra.apache.org - To unsubscribe, e-mail: commits-unsubscr...@echarts.apache.org For additional commands, e-mail: commits-h...@echarts.apache.org