This is an automated email from the ASF dual-hosted git repository.
sushuang pushed a change to branch release
in repository https://gitbox.apache.org/repos/asf/echarts.git
from 86eba716f Merge pull request #17190 from apache/release-dev
add 032e73835 fix(typo): Trasition -> Transition
This is an automated email from the ASF dual-hosted git repository.
sushuang pushed a commit to branch release
in repository https://gitbox.apache.org/repos/asf/echarts.git
commit 3e068d7a47f0158efdf98a60606b8f72ac6174e4
Merge: 86eba716f db866d8e7
Author: sushuang
AuthorDate: Thu Aug 25 14:35:06
echarts-bot[bot] commented on PR #17570:
URL: https://github.com/apache/echarts/pull/17570#issuecomment-1226836407
Congratulations! Your PR has been merged. Thanks for your contribution! 👍
--
This is an automated message from the Apache Git Service.
To respond to the message, please log on
100pah merged PR #17570:
URL: https://github.com/apache/echarts/pull/17570
--
This is an automated message from the Apache Git Service.
To respond to the message, please log on to GitHub and use the
URL above to go to the specific comment.
To unsubscribe, e-mail: commits-unsubscr...@echarts.a
mousne commented on PR #17551:
URL: https://github.com/apache/echarts/pull/17551#issuecomment-1226805312
> Can you provide a renference to explain the changes because I cannot find
this [in
v4](https://github.com/apache/echarts/commit/728ae6394632fa9735402b06647a82d170caeede#diff-bc54450577
pe-3 commented on code in PR #17461:
URL: https://github.com/apache/echarts/pull/17461#discussion_r954479080
##
src/chart/funnel/FunnelSeries.ts:
##
@@ -19,8 +19,8 @@
import * as zrUtil from 'zrender/src/core/util';
import createSeriesDataSimply from '../helper/createSeriesD
pe-3 commented on code in PR #17461:
URL: https://github.com/apache/echarts/pull/17461#discussion_r954478670
##
src/chart/funnel/FunnelView.ts:
##
@@ -167,8 +169,141 @@ class FunnelPiece extends graphic.Polygon {
stroke: visualColor
});
}
+
+ratePi
pe-3 commented on code in PR #17461:
URL: https://github.com/apache/echarts/pull/17461#discussion_r954478604
##
src/chart/funnel/FunnelView.ts:
##
@@ -167,8 +169,141 @@ class FunnelPiece extends graphic.Polygon {
stroke: visualColor
});
}
+
+ratePi
pe-3 commented on code in PR #17461:
URL: https://github.com/apache/echarts/pull/17461#discussion_r954477455
##
src/chart/funnel/FunnelSeries.ts:
##
@@ -94,7 +94,15 @@ export interface FunnelSeriesOption
funnelAlign?: HorizontalAlign | VerticalAlign
+exitShape?: 're
akiozhang opened a new issue, #17571:
URL: https://github.com/apache/echarts/issues/17571
### What problem does this feature solve?
url path:
https://github.com/apache/echarts/blob/master/src/component/dataZoom/SliderZoomView.ts
 an
echarts-bot[bot] commented on PR #17570:
URL: https://github.com/apache/echarts/pull/17570#issuecomment-1225999491
Thanks for your contribution!
The community will review it ASAP. In the meanwhile, please checkout [the
coding standard](https://echarts.apache.org/en/coding-standard.html) a
100pah commented on code in PR #16825:
URL: https://github.com/apache/echarts/pull/16825#discussion_r954050188
##
src/component/axis/AxisBuilder.ts:
##
@@ -602,9 +622,12 @@ function isTwoLabelOverlapped(
}
function isNameLocationCenter(nameLocation: string) {
-return nam
TuringLovesDeathMetal commented on issue #16984:
URL: https://github.com/apache/echarts/issues/16984#issuecomment-1225819091
@Ovilia I'm confused - how is this not a bug?
Surely bars aren't meant to overlap axes, or even appear _**fully outside**_
of an axis, like this:
![ima
cjw85 opened a new issue, #284:
URL: https://github.com/apache/echarts-doc/issues/284
The example here:
https://echarts.apache.org/examples/en/editor.html?c=data-transform-filter
uses `datasetId` to reference datasets from series' definitions rather that
`datasetIndex`, this does n
RahulVishK commented on issue #17569:
URL: https://github.com/apache/echarts/issues/17569#issuecomment-1225536707
here click event is working fine on indicator labels not mouseover event
--
This is an automated message from the Apache Git Service.
To respond to the message, please log on
RahulVishK opened a new issue, #17569:
URL: https://github.com/apache/echarts/issues/17569
### Version
5.3.3
### Link to Minimal Reproduction
_No response_
### Steps to Reproduce
1) use getZr() on mouseover
2) when hovered on series line and labels it is
RahulVishK commented on issue #17555:
URL: https://github.com/apache/echarts/issues/17555#issuecomment-1225528203
hi my requirement is to draw graphics for indicator labels ? is there any
way ??
--
This is an automated message from the Apache Git Service.
To respond to the message, pl
echarts-bot[bot] commented on issue #17568:
URL: https://github.com/apache/echarts/issues/17568#issuecomment-1225516583
@aShu-guo It seems you are not using English, I've helped translate the
content automatically. To make your issue understood by more people and get
helped, we'd like to su
aShu-guo opened a new issue, #17568:
URL: https://github.com/apache/echarts/issues/17568
### Version
5.3.3
### Link to Minimal Reproduction
https://codesandbox.io/s/condescending-antonelli-z1w8yi?file=/src/index.js
### Steps to Reproduce
鼠标快速单击不同地图区域
echarts-bot[bot] commented on issue #17567:
URL: https://github.com/apache/echarts/issues/17567#issuecomment-1225510451
@xiaoyao-xiaolv It seems you are not using English, I've helped translate
the content automatically. To make your issue understood by more people and get
helped, we'd like
xiaoyao-xiaolv opened a new issue, #17567:
URL: https://github.com/apache/echarts/issues/17567
### What problem does this feature solve?
象形柱图能不能增加类似下面连接的堆叠柱形图配置效果呢?
https://echarts.apache.org/examples/zh/editor.html?c=bar-y-category-stack
### What does the proposed API look l
RahulVishK opened a new issue, #17566:
URL: https://github.com/apache/echarts/issues/17566
### What problem does this feature solve?
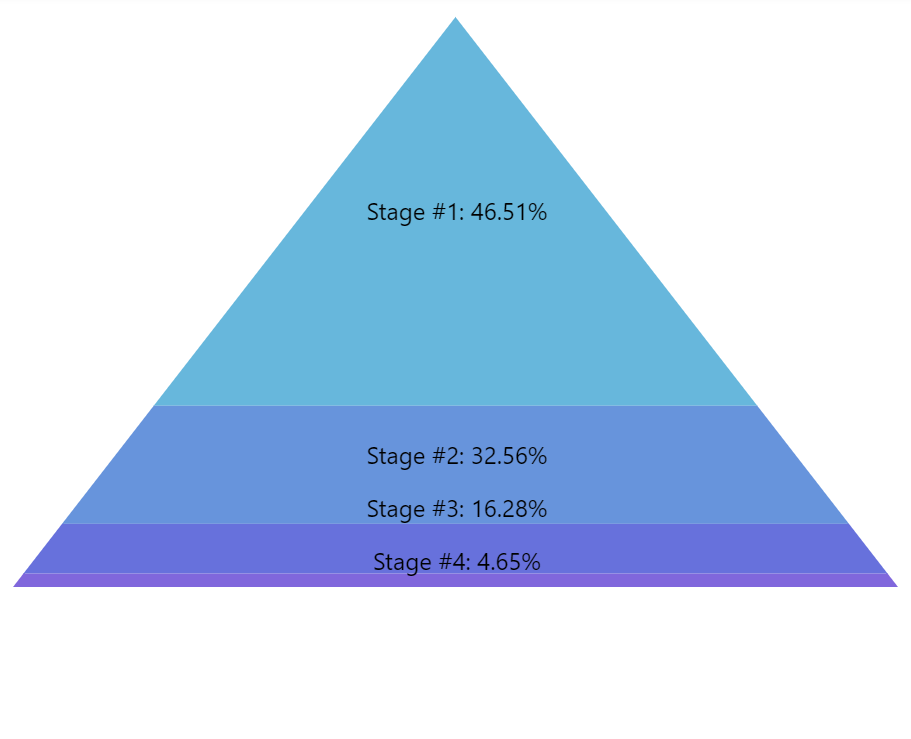
ehcarts have funnel series , but pyra
weihaopeng opened a new issue, #17565:
URL: https://github.com/apache/echarts/issues/17565
### What problem does this feature solve?
I want to set red nodes above the blue nodes, like `z-index` in css. Any
idea?
![image](https://user-images.githubusercontent.com/33681454/18638
weihaopeng opened a new issue, #17564:
URL: https://github.com/apache/echarts/issues/17564
### What problem does this feature solve?
I want to highlight a node, and its path to the root node. I use
`dispatchAction` function with `type highlight`, set the nodeIndex in the path
to `dat
echarts-bot[bot] commented on issue #17563:
URL: https://github.com/apache/echarts/issues/17563#issuecomment-1225386218
@Knell0714 It seems you are not using English, I've helped translate the
content automatically. To make your issue understood by more people and get
helped, we'd like to s
Knell0714 opened a new issue, #17563:
URL: https://github.com/apache/echarts/issues/17563
### Version
5.3.3
### Link to Minimal Reproduction
_No response_
### Steps to Reproduce
1. markArea中配置data字段为文档实例。`data: [
[
{
name: '两
weihaopeng opened a new issue, #17562:
URL: https://github.com/apache/echarts/issues/17562
### What problem does this feature solve?
I use `labelLayout.hideOverlap` attr to render a tidy canvas when I have
many nodes with label. When I emphasis a node, I can see itself is highlight,
30 matches
Mail list logo