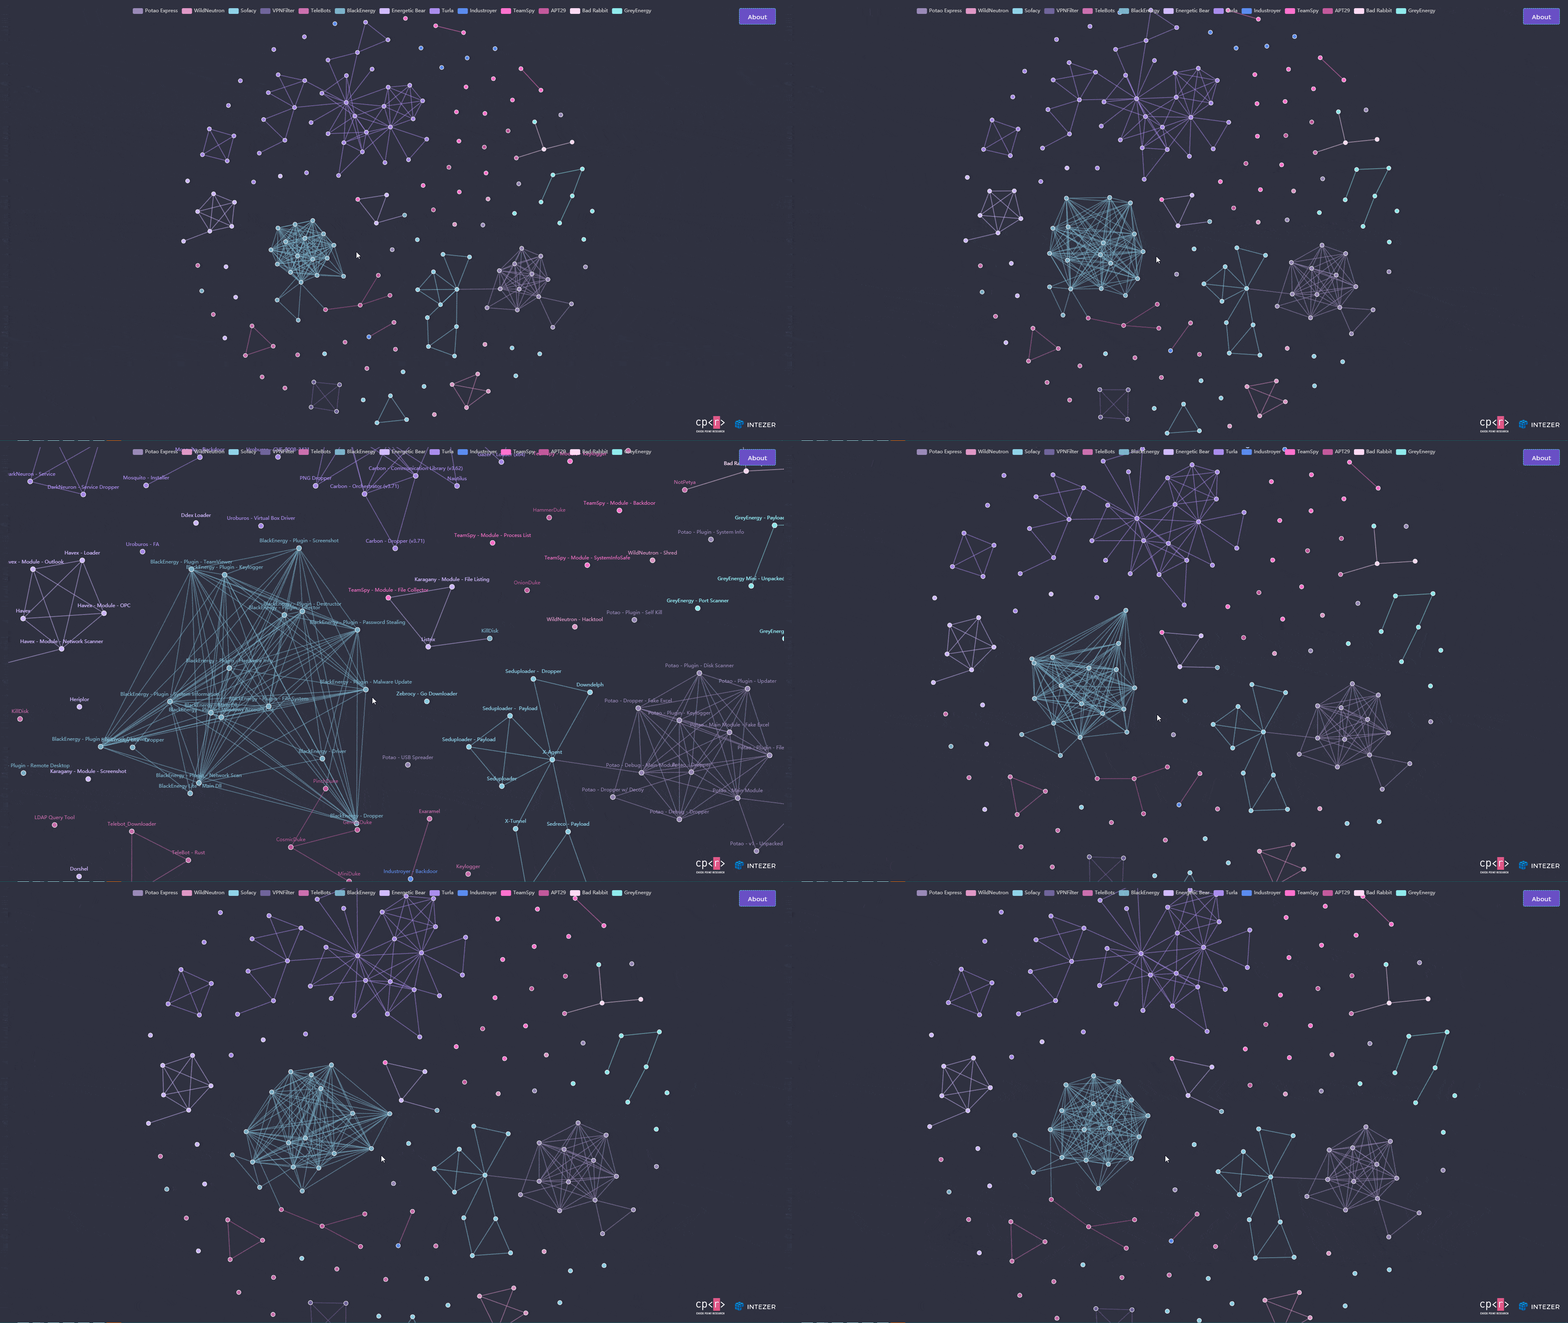
ITAYC0HEN opened a new issue #11024: Graph becomes crazy when zooming in or out URL: https://github.com/apache/incubator-echarts/issues/11024 ### Version 4.2.1 ### Steps to reproduce 1. Zoom in, see that some clusters are getting crazy 2. Zoom out, inspect the same 3. Roam around using the mouse and see that some nodes are forcibly moving ### What is actually happening? As you can see in the gif below, upon zooming using the mouse-wheel some parts of the graph are getting crazy and raving around. For example, notice the blue cluster next to the cursor.  ### What is expected? I expect the graph to zoom in and out smoothly. I don't want any other movement in the graph upon zooming ### More Details When the graph is ready and stands still, my goal is to hide the node-labels from a specific zoom and then when a user zoom in, the labels will appear again. I used data zoom in order to hook the event of zooming and calculating the scale. So ideally, I just want to hide the labels when zooming out too much and showing them when zooming in to a certain port. Here is the configuration and the related JS function. The function itself isn't the problem, the problem is in the Options (tested by removing parts) **Options** This is the JS function responsible for showing\hiding the labels ``` myChart.on('dataZoom', function (params) { var start = params.batch[0].start; var end = params.batch[0].end; if(myChart.getOption().series[0].zoom <= 0.3 && myChart.getOption().series[0].zoom != 1 && !isLabelsHidden) { myChart.setOption({series: [{label: { show: false}}]}); isLabelsHidden = true; } else if(myChart.getOption().series[0].zoom > 0.3 && myChart.getOption().series[0].zoom != 1 && isLabelsHidden) { myChart.setOption({series: [{label: { show: true}}]}); isLabelsHidden = false; } }); myChart.on('dataZoom', function (params) { var start = params.batch[0].start; var end = params.batch[0].end; if(myChart.getOption().series[0].zoom <= 0.3 && myChart.getOption().series[0].zoom != 1 && !isLabelsHidden) { myChart.setOption({series: [{label: { show: false}}]}); isLabelsHidden = true; } else if(myChart.getOption().series[0].zoom > 0.3 && myChart.getOption().series[0].zoom != 1 && isLabelsHidden) { myChart.setOption({series: [{label: { show: true}}]}); isLabelsHidden = false; } }); ``` And here are the options, configuration -- the problem happens only when adding "dataZoom", "xAxis" and "yAxis". ``` option = { title: { top: 'bottom', left: 'right' }, feature: { magicType: { type: ['line', 'bar', 'stack', 'tiled'] } }, legend: [{ // selectedMode: 'single', data: categories.map(function (a) { return a.name; }) }], animation: true, animationDuration: 1500, scaleLimit : { }, animationEasingUpdate: 'quinticInOut', dataZoom: [ { type: 'inside', }, { type: 'inside', } ], xAxis: { show: false, scale: true, silent: true, type: 'value' }, yAxis: { show: false, scale: true, silent: true, type: 'value' }, series : [ { name: 'some name', type: 'graph', layout: 'force', force: { initLayout: 'circular', edgeLength: 1200, repulsion: 100000, gravity: 0.4 }, zoom: 0.15, data: graph.nodes, links: graph.links, categories: categories, roam: true, focusNodeAdjacency: true, draggable: true, itemStyle: { normal: { borderColor: '#fff', borderWidth: 1, shadowBlur: 10, shadowColor: 'rgba(0, 0, 0, 0.3)' } }, label: { position: 'outside', show: true, formatter: '{b}' }, lineStyle: { color: 'source', curveness: 0, width: 2 }, emphasis: { lineStyle: { width: 8 } } } ] }; ``` <!-- This issue is generated by echarts-issue-helper. DO NOT REMOVE --> <!-- This issue is in English. DO NOT REMOVE -->
----------------------------------------------------------------
This is an automated message from the Apache Git Service.
To respond to the message, please log on to GitHub and use the
URL above to go to the specific comment.

For queries about this service, please contact Infrastructure at:
us...@infra.apache.org


With regards,
Apache Git Services

---------------------------------------------------------------------
To unsubscribe, e-mail: dev-unsubscr...@echarts.apache.org
For additional commands, e-mail: dev-h...@echarts.apache.org
