Hi,

I am having really weird results with a counter.  I am not a newbie to
RRDtool, but have usually done gauges (and gauges are working just fine on
the same server)
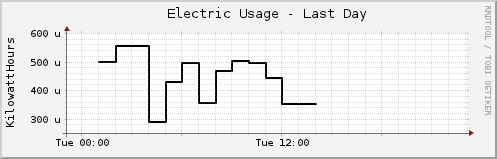
My objective is very simple.  I am trying to graph my electric usage.  I am
updating the meter reading (counter) every hour and trying to plot a simple
2 day graph.   I am getting really small numbers (.000x) so they show up
with the suffix "u" in the graph and effectively zero when I set 0-30 as
the low/high.  I am seeing usage of 1-2 KWh/hour when I look at the raw
data.

I am almost suspicious there is a build problem (Ubuntu pre-compiled
package), though I never rule out a "layer 8" problem ;)  I did try the
odometer example in the tutorial, and got similarly wacky results (0-40
"m").

RRDtool 1.4.3  Copyright 1997-2009 by Tobias Oetiker <t...@oetiker.ch>
Compiled Mar 26 2011 03:16:40 (Ubuntu package 1.4.3-1ubuntu1)

Here is my very simple create line.  My intent for this basic example is to
update every hour and save 24 hours.

rrdtool create test.rrd --start 1322500000 --step=3600
DS:kwH:COUNTER:7200:U:U RRA:AVERAGE:0.5:1:24

And the data I am pumping into it:

rrdtool update test.rrd 1322530107:36469
rrdtool update test.rrd 1322532117:36470
rrdtool update test.rrd 1322535717:36472
rrdtool update test.rrd 1322539317:36474
rrdtool update test.rrd 1322542917:36475
rrdtool update test.rrd 1322545523:36476
rrdtool update test.rrd 1322548975:36478
rrdtool update test.rrd 1322552578:36479
rrdtool update test.rrd 1322554380:36480
rrdtool update test.rrd 1322558882:36482
rrdtool update test.rrd 1322562486:36484
rrdtool update test.rrd 1322566990:36486
rrdtool update test.rrd 1322571494:36488
rrdtool update test.rrd 1322575316:36489

The output of fetch:

rrdtool fetch test.rrd AVERAGE
                            kwH

1322521200: -nan
1322524800: -nan
1322528400: -nan
1322532000: 4.9751243781e-04
1322535600: 5.5366915423e-04
1322539200: 5.5555555556e-04
1322542800: 2.8680555556e-04
1322546400: 4.2794756663e-04
1322550000: 4.9343719761e-04
1322553600: 3.5629512847e-04
1322557200: 4.6823025833e-04
1322560800: 5.0322121534e-04
1322564400: 4.9598285308e-04
1322568000: 4.4404973357e-04
1322571600: 3.5016099546e-04
1322575200: 3.5016099546e-04
1322578800: -nan
1322582400: -nan
1322586000: -nan
1322589600: -nan
1322593200: -nan
1322596800: -nan
1322600400: -nan
1322604000: -nan
1322607600: -nan

And the graph created by this line:

rrdtool graph dillon_temp_electriclast48hrs.
png -t "Dillon Electric Usage - Last 2 Days" -v "KilowattHours" --start
-1d  --end now DEF:kw=test.rrd:kwH:AVERAGE LINE2:kw#000000

is posted here:
http://extranet.jrp2.com/tempjunk/dillon_temp_electriclast24hrs.png

Any thoughts or ideas appreciated.  I am really hoping I did something dumb!

Thanks,

JP
_______________________________________________
rrd-users mailing list
rrd-users@lists.oetiker.ch
https://lists.oetiker.ch/cgi-bin/listinfo/rrd-users