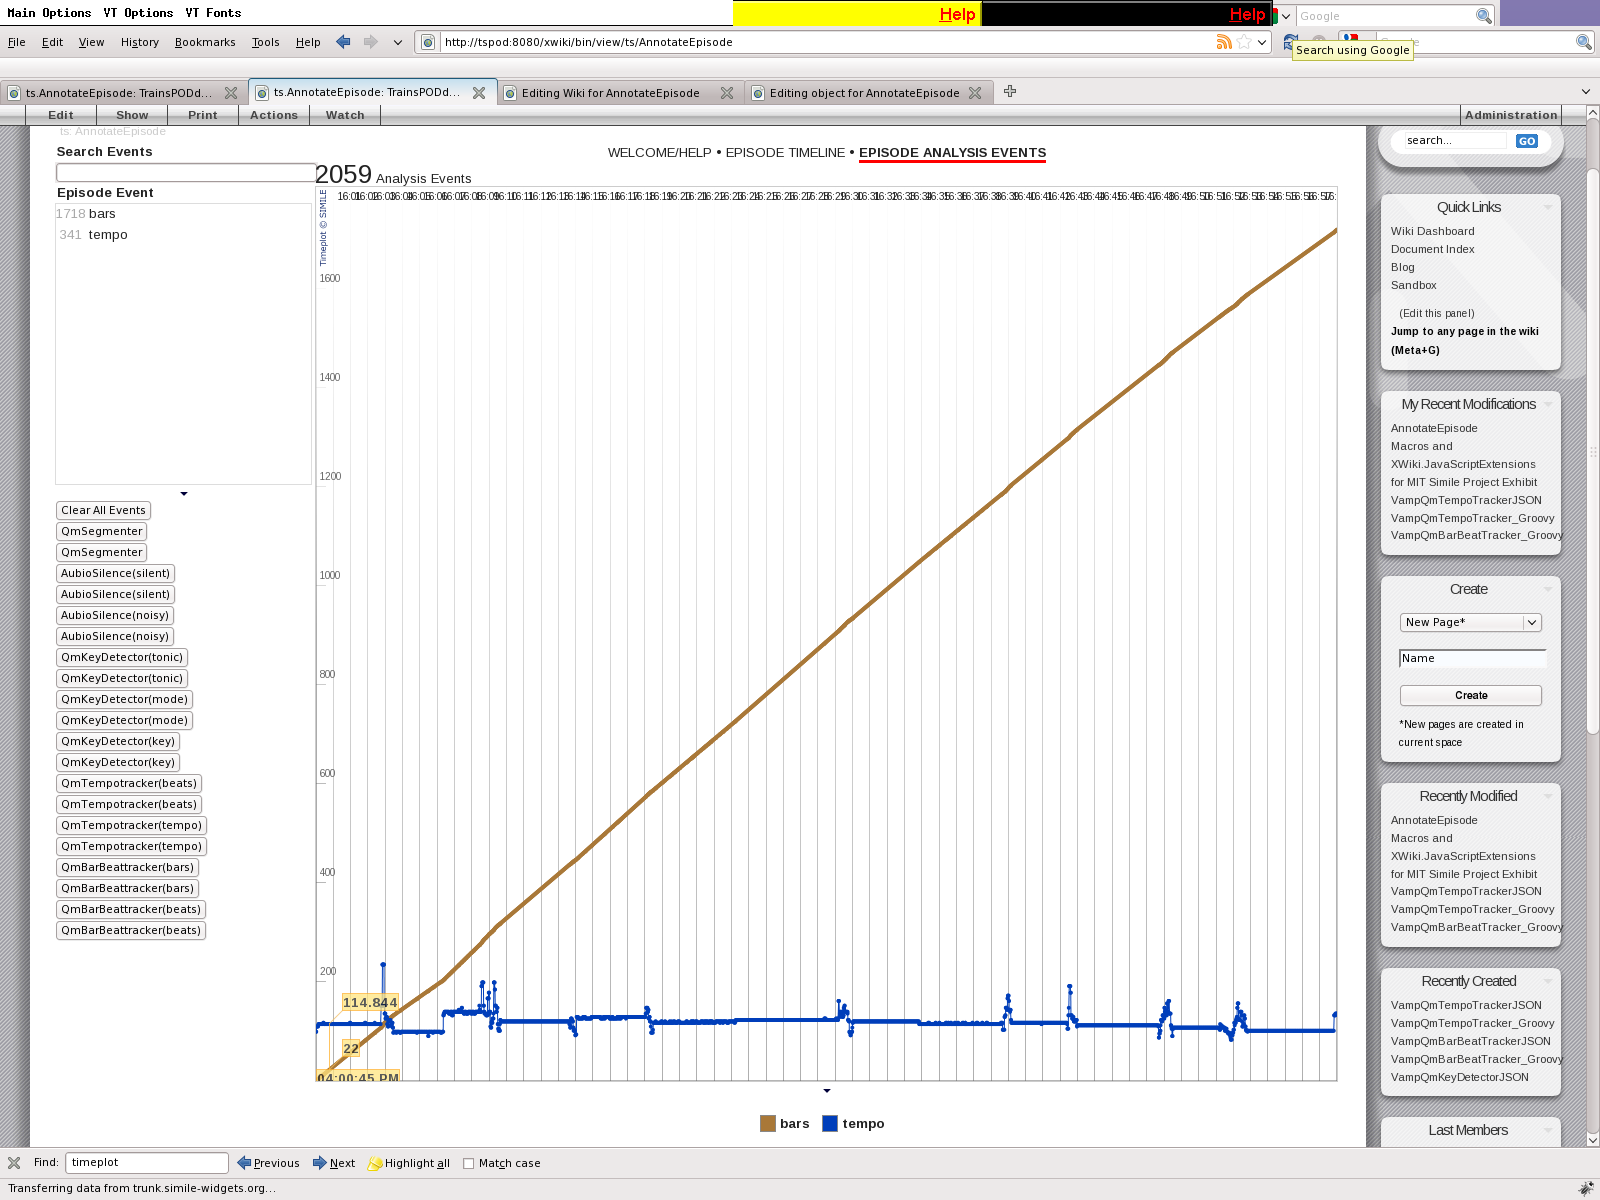
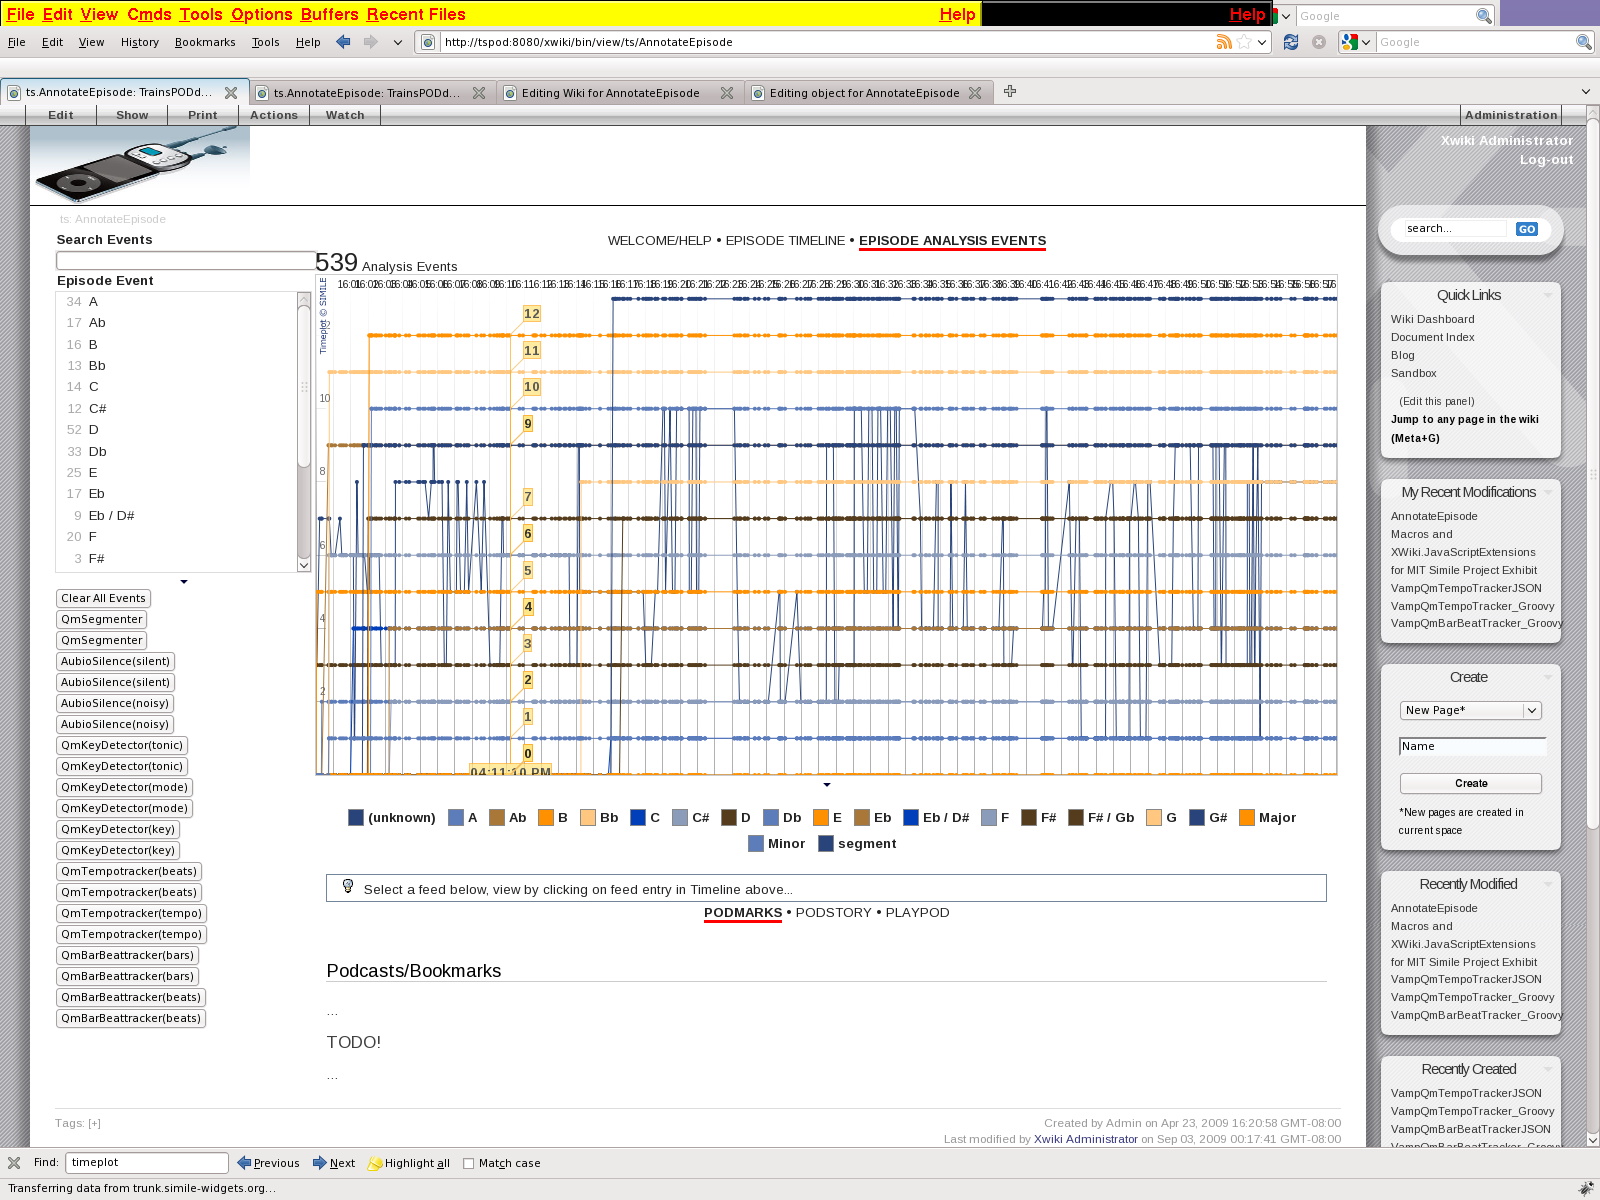
I've had to override some methods in Timeplot to get it to prevent them from
looking all wrong, e.g.
http://nielsmayer.com/mjspecial-bars-vs-tempo-in-timeplot.png
http://nielsmayer.com/mjspecial-tonic-key-segmenter-in-timeplot.png
 /*
  * NPM BUGFIX Timeplot.DefaultTimeGeometry.prototype._calculateGrid
originally from
  *
http://code.google.com/p/simile-widgets/source/browse/timeplot/trunk/src/webapp/api/scripts/geometry.js
  * This particular change comes from a patch supplied on Timeplot:
  * http://code.google.com/p/simile-widgets/issues/detail?id=312
  * "Changed global 'unit' variable to be of local scope"
  * (which also corrects a programming issue)
  * -------------
  * This function calculates the grid spacing that it will be used
  * by this geometry to draw the grid in order to reduce clutter.
  */
 Timeplot.DefaultTimeGeometry.prototype._calculateGrid = function() {
        var grid = [];

        var time = SimileAjax.DateTime;
        var u = this._unit;
        var p = this._period;

        if (p == 0) return grid;

        var unit = time.MILLENNIUM;; /*was:(missing)*/
        // find the time units nearest to the time period
/*was:
        if (p > time.gregorianUnitLengths[time.MILLENNIUM]) {
           unit = time.MILLENNIUM;
        } else {
*/
        if (p <= time.gregorianUnitLengths[time.MILLENNIUM]) {
            for ( /*was:var unit = time.MILLENNIUM*/ ; unit > 0; unit--) {
                if (time.gregorianUnitLengths[unit-1] <= p && p <
time.gregorianUnitLengths[unit]) {
                    unit--;
                    break;
                }
            }
        }

        var t = u.cloneValue(this._earliestDate);

        do {
            time.roundDownToInterval(t, unit, this._timeZone, 1, 0);
            var x = this.toScreen(u.toNumber(t));
         /*
          * NPM: changed switch() cases below to work in UTC correctly when
using timeplot's
          * ex:timeGeometry="timeplotGeometer" == new
Timeplot.DefaultTimeGeometry({ timeZone: 0 })
          * Prior code incorrectly used t.toLocaleTimeString() &
t.toLocaleDateString() which caused
          * data to be printed in local timezone rather than the data's
UTC/GMT timezone. Also,
          * original code printed labels that overlapped due to varying
length and long sizes.
          */
            switch (unit) {
                case time.SECOND:
                  var s = t.getUTCSeconds();
                  var l = ((s < 10) ? "0" : "") + s;
                  break;
                case time.MINUTE:
                  var m = t.getUTCMinutes();
                  var l = ((m < 10) ? "0" : "") + m;
                  break;
                case time.HOUR:
                  var h = t.getUTCHours();
                  var l = ((h < 10) ? "0" : "") + h + ":00";
                  break;
                case time.DAY:
                case time.WEEK:
                case time.MONTH:
                  var l = t.toUTCString();
                  break;
                case time.YEAR:
                case time.DECADE:
                case time.CENTURY:
                case time.MILLENNIUM:
                  var l = t.getUTCFullYear();
                  break;
            }
            if (x > 0) {
                grid.push({ x: x, label: l });
            }
            time.incrementByInterval(t, unit, this._timeZone);
        } while (t.getTime() < this._latestDate.getTime());

        return grid;
  };

  /**
   * NPM BUGFIX Timeplot.Plot.prototype.initialize() originally from
   *
http://code.google.com/p/simile-widgets/source/browse/timeplot/trunk/src/webapp/api/scripts/plot.js
   * --------------
   * Initialize the plot layer
   */
  Timeplot.Plot.prototype.initialize = function() {
        if (this._dataSource && this._dataSource.getValue) {
            this._timeFlag =
this._timeplot.putDiv("timeflag","timeplot-timeflag");
            this._valueFlag = this._timeplot.putDiv(this._id +
"valueflag","timeplot-valueflag");
            this._valueFlagLineLeft = this._timeplot.putDiv(this._id +
"valueflagLineLeft","timeplot-valueflag-line");
            this._valueFlagLineRight = this._timeplot.putDiv(this._id +
"valueflagLineRight","timeplot-valueflag-line");
            if (!this._valueFlagLineLeft.firstChild) {


this._valueFlagLineLeft.appendChild(SimileAjax.Graphics.createTranslucentImage(Timeplot.urlPrefix
+ "images/line_left.png"));


this._valueFlagLineRight.appendChild(SimileAjax.Graphics.createTranslucentImage(Timeplot.urlPrefix
+ "images/line_right.png"));
            }
            this._valueFlagPole = this._timeplot.putDiv(this._id +
"valuepole","timeplot-valueflag-pole");

            var opacity = this._plotInfo.valuesOpacity;

            SimileAjax.Graphics.setOpacity(this._timeFlag, opacity);
            SimileAjax.Graphics.setOpacity(this._valueFlag, opacity);
            SimileAjax.Graphics.setOpacity(this._valueFlagLineLeft,
opacity);
            SimileAjax.Graphics.setOpacity(this._valueFlagLineRight,
opacity);
            SimileAjax.Graphics.setOpacity(this._valueFlagPole, opacity);

            var plot = this;

            var mouseOverHandler = function(elmt, evt, target) {
                if (plot._plotInfo.showValues) {
                        plot._valueFlag.style.display = "block";
                        mouseMoveHandler(elmt, evt, target);
                    }
            }

            var day = 24 * 60 * 60 * 1000;
            var month = 30 * day;

            var mouseMoveHandler = function(elmt, evt, target) {
                if (typeof SimileAjax != "undefined" &&
plot._plotInfo.showValues) {
                    var c = plot._canvas;
                    var x =
Math.round(SimileAjax.DOM.getEventRelativeCoordinates(evt,plot._canvas).x);
                    if (x > c.width) x = c.width;
                    if (isNaN(x) || x < 0) x = 0;
                    var t = plot._timeGeometry.fromScreen(x);
                    if (t == 0) { // something is wrong
                        plot._valueFlag.style.display = "none";
                        return;
                    }

                    var validTime = plot._dataSource.getClosestValidTime(t);
                    x = plot._timeGeometry.toScreen(validTime);
                    var v = plot._dataSource.getValue(validTime);
                    if (plot._plotInfo.roundValues) v = Math.round(v);
                    plot._valueFlag.innerHTML = new String(v);
                    var d = new Date(validTime);
                    var p = plot._timeGeometry.getPeriod();
                    if (p < day) {
                        plot._timeFlag.innerHTML = /*d.getUTCHours()+':'+*/
d.getUTCMinutes()+':'+d.getUTCSeconds()+'.'+d.getUTCMilliseconds()
/*was:d.toLocaleTimeString()*/ ;
                    } else if (p > month) {
                        plot._timeFlag.innerHTML = d.toLocaleDateString();
/*NPM: leave in local TZ since returns date w/o time; there's no equiv UTC
fn */
                    } else {
                        plot._timeFlag.innerHTML = d.toUTCString()
/*was:d.toLocaleString()*/ ;
                    }

                    var tw = plot._timeFlag.clientWidth;
                    var th = plot._timeFlag.clientHeight;
                    var tdw = Math.round(tw / 2);
                    var vw = plot._valueFlag.clientWidth;
                    var vh = plot._valueFlag.clientHeight;
                    var y = plot._valueGeometry.toScreen(v);

                    if (x + tdw > c.width) {
                        var tx = c.width - tdw;
                    } else if (x - tdw < 0) {
                        var tx = tdw;
                    } else {
                        var tx = x;
                    }

                    if (plot._timeGeometry._timeValuePosition == "top") {
                        plot._timeplot.placeDiv(plot._valueFlagPole, {
                            left: x,
                            top: th - 5,
                            height: c.height - y - th + 6,
                            display: "block"
                        });
                        plot._timeplot.placeDiv(plot._timeFlag,{
                            left: tx - tdw,
                            top: -6,
                            display: "block"
                        });
                    } else {
                        plot._timeplot.placeDiv(plot._valueFlagPole, {
                            left: x,
                            bottom: th - 5,
                            height: y - th + 6,
                            display: "block"
                        });
                        plot._timeplot.placeDiv(plot._timeFlag,{
                            left: tx - tdw,
                            bottom: -6,
                            display: "block"
                        });
                    }

                    if (x + vw + 14 > c.width && y + vh + 4 > c.height) {
                        plot._valueFlagLineLeft.style.display = "none";
                        plot._timeplot.placeDiv(plot._valueFlagLineRight,{
                            left: x - 14,
                            bottom: y - 14,
                            display: "block"
                        });
                        plot._timeplot.placeDiv(plot._valueFlag,{
                            left: x - vw - 13,
                            bottom: y - vh - 13,
                            display: "block"
                        });
                    } else if (x + vw + 14 > c.width && y + vh + 4 <
c.height) {
                        plot._valueFlagLineRight.style.display = "none";
                        plot._timeplot.placeDiv(plot._valueFlagLineLeft,{
                            left: x - 14,
                            bottom: y,
                            display: "block"
                        });
                        plot._timeplot.placeDiv(plot._valueFlag,{
                            left: x - vw - 13,
                            bottom: y + 13,
                            display: "block"
                        });
                    } else if (x + vw + 14 < c.width && y + vh + 4 >
c.height) {
                        plot._valueFlagLineRight.style.display = "none";
                        plot._timeplot.placeDiv(plot._valueFlagLineLeft,{
                            left: x,
                            bottom: y - 13,
                            display: "block"
                        });
                        plot._timeplot.placeDiv(plot._valueFlag,{
                            left: x + 13,
                            bottom: y - 13,
                            display: "block"
                        });
                    } else {
                        plot._valueFlagLineLeft.style.display = "none";
                        plot._timeplot.placeDiv(plot._valueFlagLineRight,{
                            left: x,
                            bottom: y,
                            display: "block"
                        });
                        plot._timeplot.placeDiv(plot._valueFlag,{
                            left: x + 13,
                            bottom: y + 13,
                            display: "block"
                        });
                    }
                }
            }

            var timeplotElement = this._timeplot.getElement();
            SimileAjax.DOM.registerEvent(timeplotElement, "mouseover",
mouseOverHandler);
            SimileAjax.DOM.registerEvent(timeplotElement, "mousemove",
mouseMoveHandler);
        }
  };

--~--~---------~--~----~------------~-------~--~----~
You received this message because you are subscribed to the Google Groups
"SIMILE Widgets" group.
To post to this group, send email to [email protected]
To unsubscribe from this group, send email to
[email protected]
For more options, visit this group at
http://groups.google.com/group/simile-widgets?hl=en
-~----------~----~----~----~------~----~------~--~---