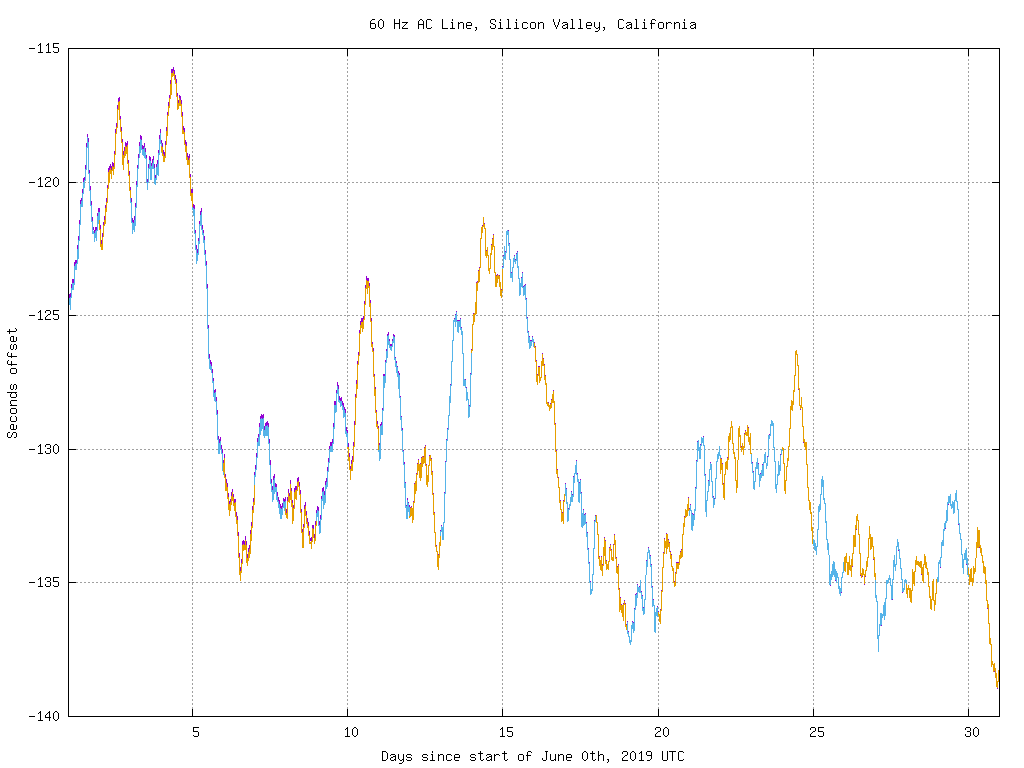
Interesting.  Thanks.

I plotted your data next to mine.
http://users.megapathdsl.net/~hmurray/time-nuts/60Hz/60Hz-2019-June.png
There are actually 2 lines there.  At this scale, they are on top of eachother.
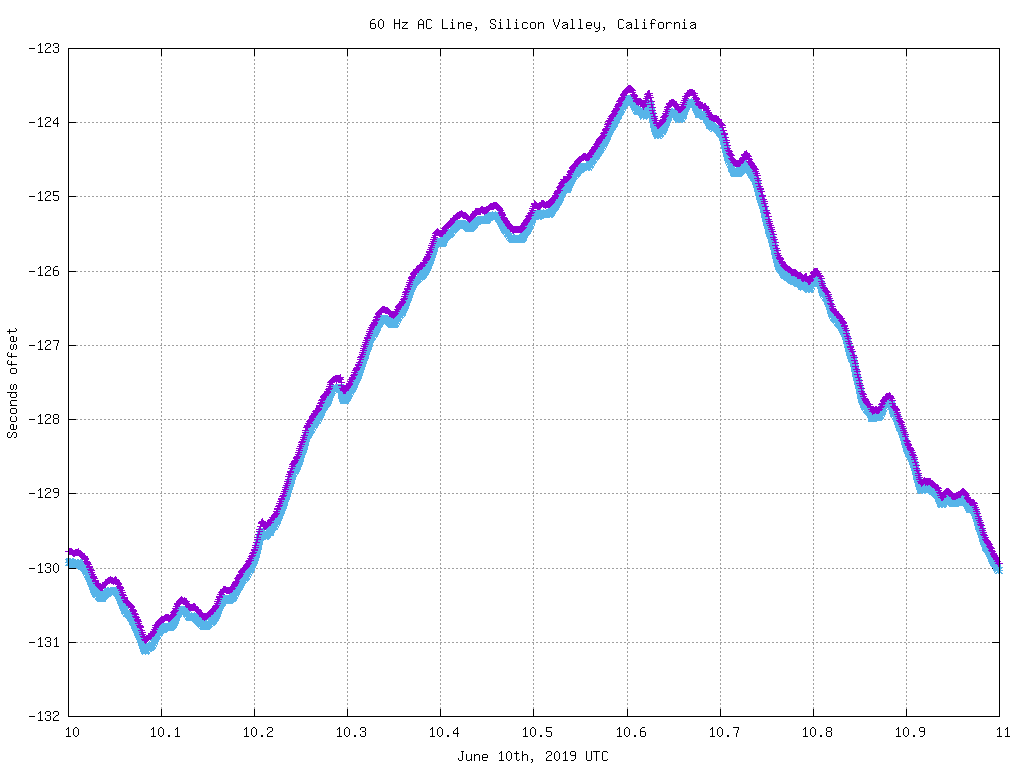
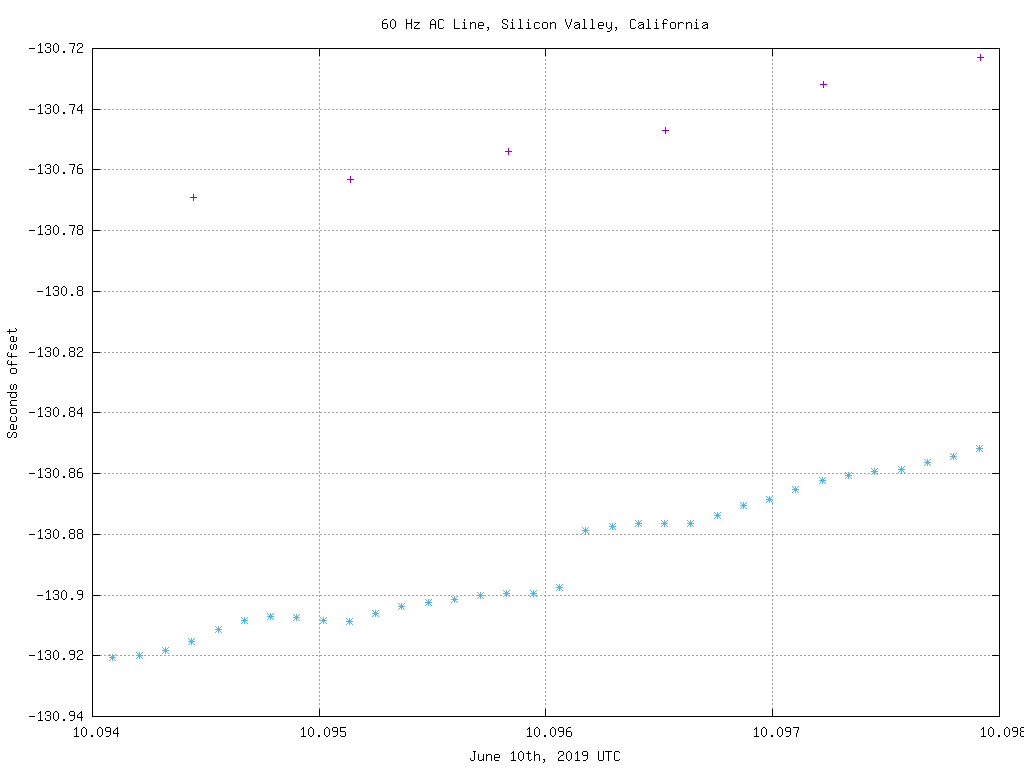
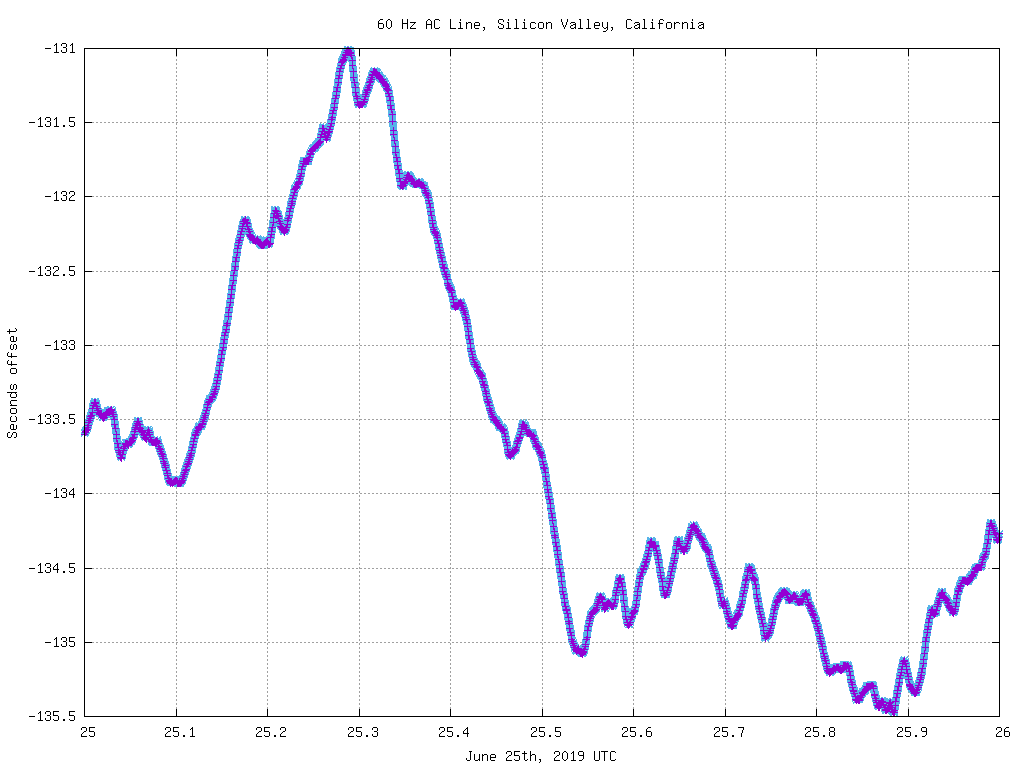
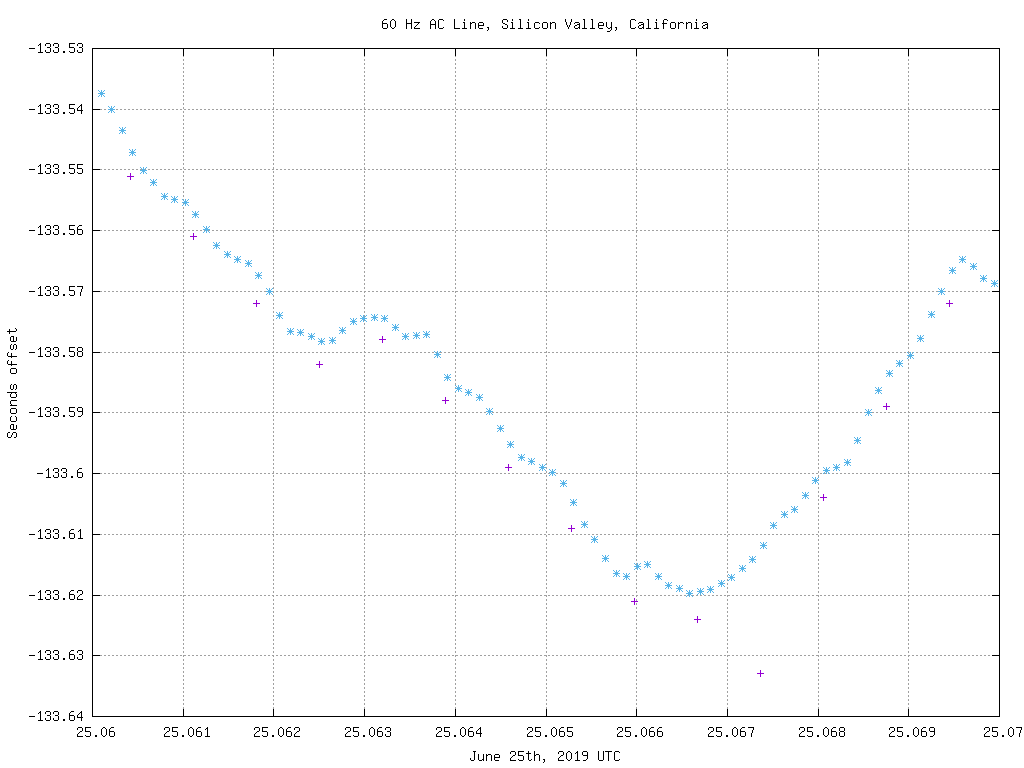
My samples are roughly every 10 seconds.  So there should be a 6 to 1 ratio.


If you zoom in, you can see some quirks.

This is June 10th.
http://users.megapathdsl.net/~hmurray/time-nuts/60Hz/60Hz-2019-June-10.png
This is zoomed in enough so that you can see the offset which is arbitary.

Zooming in farther.
http://users.megapathdsl.net/~hmurray/time-nuts/60Hz/60Hz-2019-June-10a.png
Looks like I picked up at extra cycle.  I see that occasionally - ballpark of
once a day.


This is June 25th.
http://users.megapathdsl.net/~hmurray/time-nuts/60Hz/60Hz-2019-June-25.png

Here is one area that caught my attention.
http://users.megapathdsl.net/~hmurray/time-nuts/60Hz/60Hz-2019-June-25a.png
It looks like the cycle count on one sample is off by one.

I see that occasionally.  I assume it's a missing lock in the Linux PPS kernel
API that I'm using to read the data.  I get pairs of time-stamp and count.   A
pulse comes through between when it has grabbed the time stamp and when it
grabbed the count.  The following sample looks good so it's not a extra or
missing cycle.


--
These are my opinions.  I hate spam.


_______________________________________________
time-nuts mailing list -- time-nuts@lists.febo.com
To unsubscribe, go to
http://lists.febo.com/mailman/listinfo/time-nuts_lists.febo.com
and follow the instructions there.