#19544: Add graph on bridge users by country and transport
-----------------------------------------+-----------------
     Reporter:  karsten                  |      Owner:
         Type:  enhancement              |     Status:  new
     Priority:  Medium                   |  Milestone:
    Component:  Metrics/Metrics website  |    Version:
     Severity:  Normal                   |   Keywords:
Actual Points:                           |  Parent ID:
       Points:                           |   Reviewer:
      Sponsor:                           |
-----------------------------------------+-----------------
 The following idea came up in the
 [https://trac.torproject.org/projects/tor/ticket/10218#comment:20
 discussion to provide "users-per-transport-per-country" statistics for
 obfsbridges].  This ticket is about graphing existing data, whereas the
 discussion of reporting new data will continue on #10218.  Quoting a bit
 from that ticket to have enough context here:
> It turns out that most large bridges (4 out of 5 on February 1, 2016)
only see noteworthy usage via a single transport or have requests via one
transport dominating the others in numbers (74% on the 5th large bridge on
February 1, 2016).
>
> We could assume that the distribution by country is the same for all
transports, that is, if `CC` (in `[0..1]`) requests came from a given
country and `PT` (also in `[0..1]`) requests came in via a given
transport, `x * y` requests can be attributed to that country and
transport. But that assumption may be wrong.
>
> What we could also do as first approximation is find a lower and upper
bound of users by country and transport. The lower bound would probably
be defined as something like `max(0, PT + CC - 1)` (not just `0` to
account for cases where `CC > 1 - PT`) and the upper bound as `min(PT,
CC)`, even though I could be convinced that other formulas are even more
correct.
dcf kindly graphed responses by country and transport on #10218
[https://trac.torproject.org/projects/tor/ticket/10218#comment:22 here]
and [https://trac.torproject.org/projects/tor/ticket/10218#comment:24
here], indicating that this approach may produce actually useful results.
The next step was to perform these calculations in the database and
transform number of responses to estimated user numbers. I finally found
time to work on that step. Here's a graph on Tor Metrics which is yet
"hidden" under "Advanced" until I'm more confident that it's doing the
right thing.
https://metrics.torproject.org/userstats-bridge-combined.html
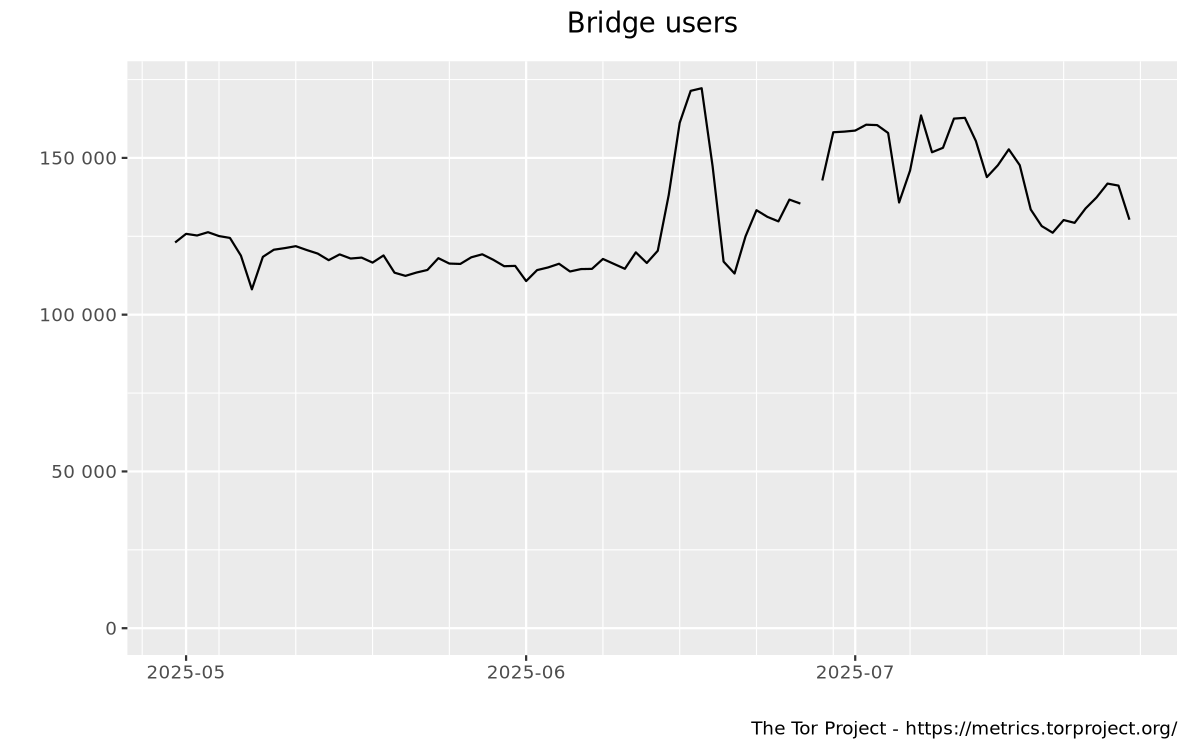
Example (image link to that graph, may look different over time):
[[Image(https://metrics.torproject.org/userstats-bridge-combined.png)]]
Next steps:
- Become more confident in the particular math and code behind this
graph. Once that's done, move the graph to "Basic" so that people will
find it. I'm attaching a branch in a minute.
- Make the user interface better. For example, we could also graph top
countries by transport, not just top transports by all countries or top
transports in a given country. Maybe we can graph other things using this
data as well.
- Make the raw data available. There's a .csv file behind this graph,
but I didn't put that on Tor Metrics yet, because we might have to change
the data format and lack a versioning system to do that. I'm putting up a
[https://people.torproject.org/~karsten/volatile/userstats-
combined-2016-07-01.csv snapshot of that file] (36.4M) for review.
--
Ticket URL: <https://trac.torproject.org/projects/tor/ticket/19544>
Tor Bug Tracker & Wiki <https://trac.torproject.org/>
The Tor Project: anonymity online
_______________________________________________
tor-bugs mailing list
tor-bugs@lists.torproject.org
https://lists.torproject.org/cgi-bin/mailman/listinfo/tor-bugs