Dear All

For the next release, I've added support for non-text datasets as labels.
There isn't any support for how the numbers are formatted, however. It might
be useful to have a number or date to text dataset plugin to do the
conversion, however.
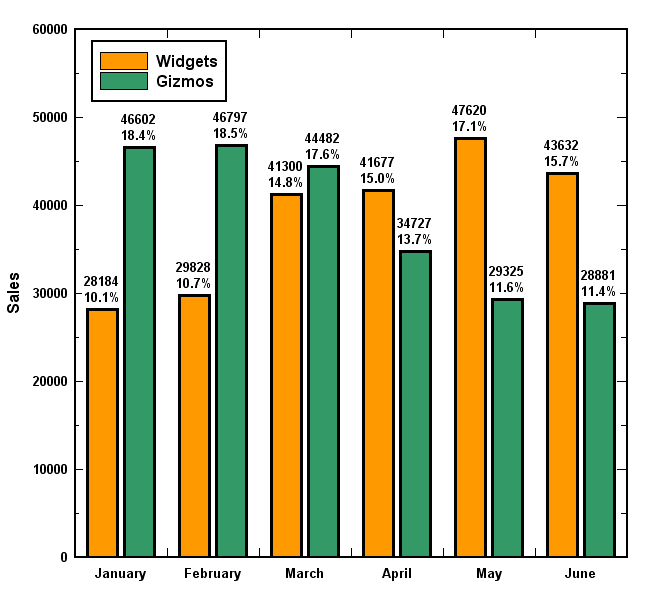
Jeremy

Joseph Xu wrote:

> Hi Benjamin:
>
> Thanks, that works! The only problem is that the labels don't
> automatically update when the dataset it's based on changes, but it's
> not a big deal.
>
> Joseph
>
> On Mon, Sep 23, 2013 at 8:47 PM, Benjamin K. Stuhl
> <[email protected]> wrote:
>> On 9/23/2013 5:38 PM, Joseph Xu wrote:
>>>
>>> I'm trying to make a bar chart with numeric labels at the top, kind of
>>> like this:
>>>
>>> http://www.dplot.com/barchart/barchart3_h600.png
>>>
>>> I tried to do this by adding an additional x-y plot with hidden
>>> markers and the bar chart length for both the y position and the
>>> labels. However, it seems like you can't use numeric data sets for
>>> labels. I tried some other things, like creating a dataset using
>>> "str(y)" for the expression, but that fails also. Is there any way to
>>> hack around this?
>>
>>
>> Hi Joseph,
>>   Your idea about creating a dataset using str(y) is a good one, it just
>> takes a bit more typing at the veusz console command line. If your
>> numeric dataset is named 'y', you could create a text label dataset by
>>
>> SetDataText('y_labels', [ str(v) for v in GetData('y')[0] ])
>>
>> for example. I hope this helps with your goal!
>>
>> Regards,
>> -- BKS
>>


_______________________________________________
Veusz-discuss mailing list
[email protected]
https://mail.gna.org/listinfo/veusz-discuss