I generate the chart from a google slide. (Yeah, I feel guilty about not
generating from a source that can be source-controlled.) I can share the slide
if others want to update.
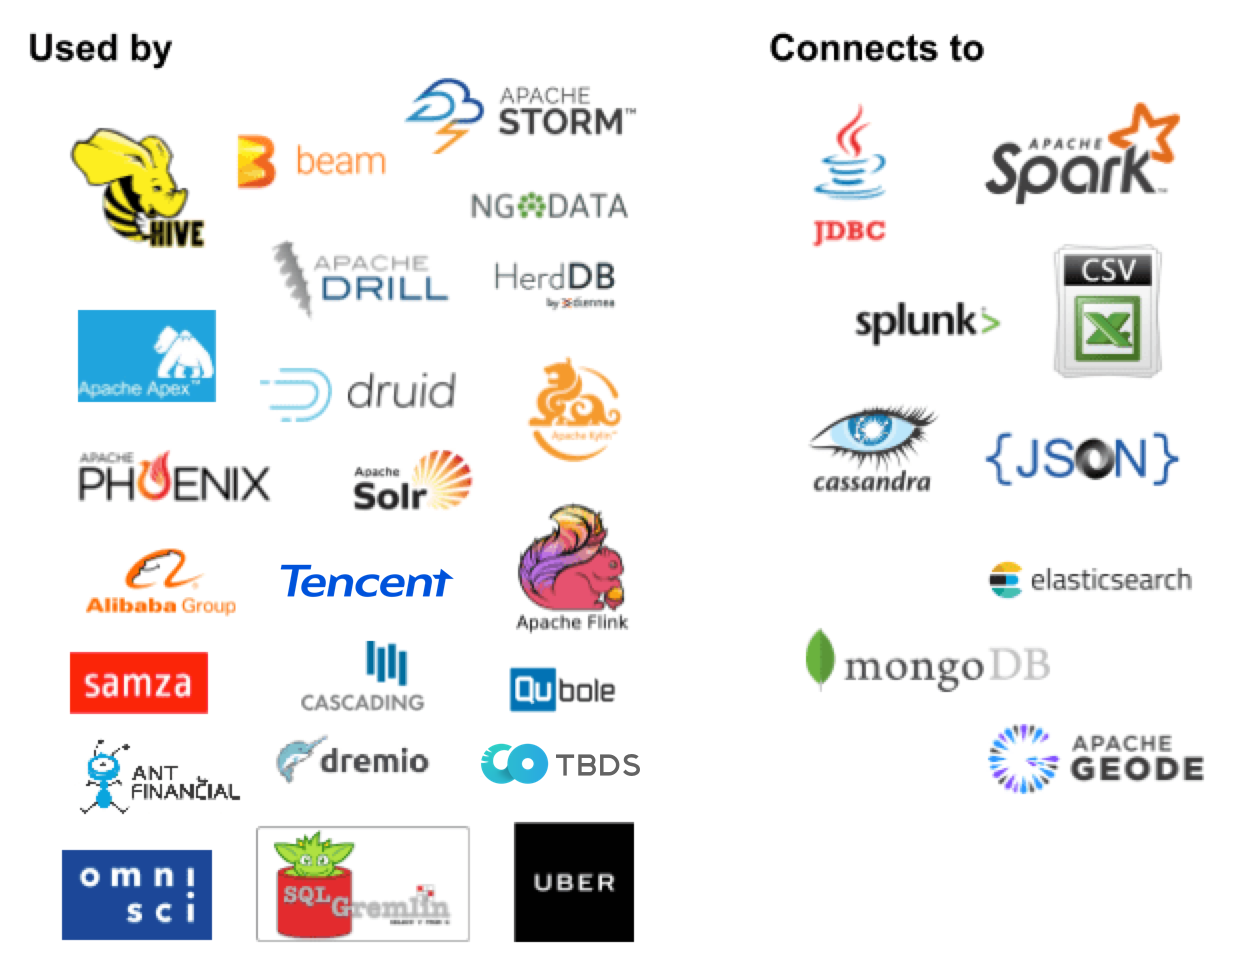
And I suppose if you want clickable there’s good old HTML image maps.

Julian


> On Feb 8, 2018, at 1:30 PM, Michael Mior <[email protected]> wrote:
>
> I'm personally not a big fan of the chart in general. I love the powered by
> page, but the chart is somewhat annoying to update and doesn't link out to
> the external projects. I would prefer actually listing out the projects
> (still with logos). However, I understand that having the chart on the
> webpage is nice to quickly drop into presentations so I don't feel too
> strongly about changing this.
>
> As for the research contributions, I really don't think a similar chart is
> the best way to do this. I think it would be much nicer to give the full
> citation information and a link to the project. I'm certainly not opposed
> to having a chart on top of this, but that means we need to have some type
> of visual representation of each project which I don't think we have the
> skills to do effectively.
>
> --
> Michael Mior
> [email protected]
>
> 2018-02-08 16:21 GMT-05:00 Julian Hyde <[email protected]>:
>
>> Edmon,
>>
>> Thank you for taking the initiative with this. The web page and the
>> monthly meeting are excellent ideas. In addition, people can of course
>> start discussions on the dev list. (In the Apache way, the “dev” list is
>> not just for development - it is more like the kitchen table, where
>> anything can be discussed.)
>>
>> We have successfully and concisely communicated our “D” collaborations
>> using the “powered by” page https://calcite.apache.org/
>> docs/powered_by.html <https://calcite.apache.org/docs/powered_by.html>
>> and its logo chart https://calcite.apache.org/img/powered-by.png. The
>> logo chart features in most of our presentations, because it is a great
>> tool: you can show it for 15 seconds, wave a hand and say “we integrate
>> with a lot of projects”, or you can talk in depth about the adapters for 15
>> minutes. Do you think research projects should be featured on the “powered
>> by” page and chart? (Or perhaps a separate chart?)
>>
>> Julian
>>
>>
>>
>>> On Feb 8, 2018, at 1:06 PM, Edmon Begoli <[email protected]> wrote:
>>>
>>> Dear members of Calcite project:
>>>
>>> Here are some updates and plans from the members of the Calcite project
>> who
>>> are focused on the R&D with and for Calcite.
>>>
>>> 1. As you know, our Calcite paper was accepted to SIGMOD, and we are now
>>> working on the final, camera-ready submission. Conference is June 10th -
>>> June 15th, 2018 in Houston. Julian and I will co-present.
>>>
>>> 2. We are moving forward with other R&D initiatives:
>>>
>>>   a) Development of the Calcite benchmark, CALCITE-2168
>>> <https://issues.apache.org/jira/browse/CALCITE-2168>
>>>   b) Performance profiling and study, CALCITE-2169
>>> <https://issues.apache.org/jira/browse/CALCITE-2169>
>>>   c) Performance optimizations, and improvements (if needed, and if
>>> deduced from by a and b)
>>>   d) Research into applications of semantic/RDF/graph technologies, and
>>> streams reasoning
>>>
>>> and work on code improvements, and publications resulting from 2. a) -
>> 2. d)
>>>
>>> 4. Having a monthly, online R&D community meeting (TBD, Edmon will
>>> coordinate)
>>>
>>> 5. Develop a sub-page on the main site () called "Research with Calcite",
>>> Edmon will developed
>>> (credit for idea to Riccardo Tomassini)
>>>
>>> Finally, here is the document that we will use to document general work
>> of
>>> the Calcite research sub-community:
>>> https://goo.gl/zmqdU1
>>>
>>> If you want get involved, and contribute to any sub-area please email me,
>>> and I will get you an edit access, and access to a specific document for
>>> the R&D sub-area.
>>>
>>> Thank you,
>>> Edmon
>>
>>