On Monday, August 11, 2014 10:27:09 PM UTC+2, Christopher Broome wrote:
>
> I came here to report on #3 specifically.  Attached a screenshot.  This
> happens quite frequently after a page refresh.
>
Can you provide a test case
<https://getfirebug.com/wiki/index.php/Creating_a_Test_Case> for that, too,
so this can be reproduced?
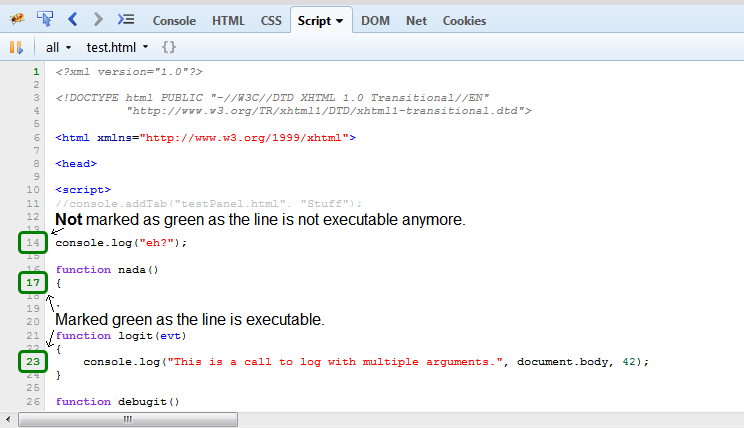
In terms of #1: two reasons.
>
This was mentioned again in another thread
<https://groups.google.com/d/msg/firebug/EDHH1M_tTbY/0HCB64vbKaAJ>, so I
said it should be reported as issue.

As for #4, the version I'm using 1.12.8 shows me the source file and line.
>  If the browser is failing during parsing, and can tell me the exact line
> of code, then I should be able to see that line of code in the debugger as
> well. (that is, the file has been loaded already since the browser *tried*
> to parse it, so it is in memory somewhere.)
>
Exactly. Though the info about the position within the code comes from
Firefox APIs, not from Firebug itself, though we currently don't get the
source itself through these APIs at the moment. That's why I created bug
1043825 <https://bugzilla.mozilla.org/show_bug.cgi?id=1043825>.

#5 is likely more to do with animation than with d3, in that some print /
> draw buffers are queuing up or something.
>
This still needs some test case, so it can be reproduced.

#6 is probably unrelated to 7301. In my case, it's not stopping on phantom
> breakpoints. It's stopping on breakpoints that exist. The problem is that
> the breakpoints are getting triggered during parsing rather than execution.
> This means I have to basically disable the breakpoint, reload the page, add
> the breakpoint after the file has been parsed (code line numbers are
> green). Sometimes the code never goes 'green', despite functioning
> correctly. I can reproduce regularly, but I can't simplify. My project has
> 50-100 js files being loaded via requirejs. (obviously they'll be compiled
> for prod).
>
Let me clarify how the marking of lines as executable works. Lines, which
are in the global scope will just be executed once, so they will *not* be
marked as executable once the page is loaded. See the following screenshot
for an illustration.


<https://lh4.googleusercontent.com/-Lnu3QEm6ukQ/U-sWg2cllVI/AAAAAAAAAac/Le0yFyq0ORM/s1600/executableLines.png>

If you set a breakpoint at line 14, you'll see that it get's marked in
green and hit when you reload the page.

To get back to your statement about breakpoints being hit while the code is
parsed: So this means you have a breakpoint within a function, which isn't
executed yet, though the breakpoint is hit? What do you see inside the
*Stack* side panel
<https://getfirebug.com/wiki/index.php?title=Stack_Side_Panel> then?

Sebastian

--
You received this message because you are subscribed to the Google Groups
"Firebug" group.
To unsubscribe from this group and stop receiving emails from it, send an email
to [email protected].
To post to this group, send email to [email protected].
Visit this group at http://groups.google.com/group/firebug.
To view this discussion on the web visit
https://groups.google.com/d/msgid/firebug/615ffffb-52a4-4dd9-b8c0-fbf5729cd511%40googlegroups.com.
For more options, visit https://groups.google.com/d/optout.