On Tue, 27 Jun 2006, Fabian Keil wrote:
There was a "request" for Tor related problem reports a while ago, I
couldn't find the message again, but I believe it was posted here.
I'm very interested in tracking down this problem, but have had a lot of
trouble getting reliable reports of problems -- i.e., ones where I could get
any debugging information. I had a similar conversation on these lines
yeterday with Roger (Tor author) here at the WEIS conference. If this is
easily reproduceable, I would like you to do the following:
- Compile in options DDB, options KDB, options BREAK_TO_DEBUGGER, options
  WITNESS, options WITNESS_SKIPSPIN, options INVARIANTS, options
  INVARIANT_SUPPORT.

- Make sure to have a kernel with debugging symbols for the kernel.

- Turn on core dumps.
The above debugging options will have a significant performance impact, and
may or may not affect the probability of the race or deadlock being exercised.
The first question is:
- Are there any warnings on the console from WITNESS or other debugging
  options?  If so, please copy/paste them into an e-mail for me.

- Does a panic occur?  If so, the output of the following comments would be
  very useful:

  show pcpu
  show allpcpu
  ps
  show locks
  show alllocks
  show lockedvnods
  trace

  Then walk the list of all processes listed in 'show alllocks', and run trace
  on each pid.

- Does the hang occur?  If so, use a serial break to get into DDB, see the
  above.

In both of the last two cases, attempt to get a core dump.

Robert N M Watson
Computer Laboratory
University of Cambridge
Last week I installed:
FreeBSD tor.fabiankeil.de 6.1-RELEASE-p2 FreeBSD
6.1-RELEASE-p2 #0: Fri Jun 23 20:06:57 CEST 2006
[EMAIL PROTECTED]:/usr/obj/usr/src/sys/BIGSLEEP i386.
At the moment it is only acting as Tor node
<http://serifos.eecs.harvard.edu/cgi-bin/desc.pl?q=zwiebelsuppe>
tor-devel (maintainer CC'd) is running jailed in a Geli image,
ntpd, named, cron and sshd are running in the host system
and that's about it. No mail or web server and nearly no traffic
besides the one caused by Tor.
I started Tor Friday night and had to reset the box three times
since then. The server just suddenly stops responding, the logs
stop as well, therefore I assume it either panics or hangs.
I only have remote access, a serial console is available,
but it becomes unresponsive as well. I didn't configure DDB yet,
so maybe that is to be expected?
cron creates some stats every five minutes, a few minutes
before a hang this morning the load was:
last pid: 7996; load averages: 0.40, 0.37, 0.36 up 0+18:38:25 05:55:02
83 processes: 2 running, 66 sleeping, 15 waiting
CPU states: 21.3% user, 0.0% nice, 17.8% system, 20.2% interrupt, 40.7% idle
Mem: 100M Active, 157M Inact, 102M Wired, 12K Cache, 60M Buf, 134M Free
Swap: 1024M Total, 1024M Free
PID USERNAME THR PRI NICE SIZE RES STATE TIME WCPU COMMAND
11 root 1 171 52 0K 8K RUN 857:30 53.61% idle
12 root 1 -44 -163 0K 8K WAIT 45:22 6.54% swi1: net
23 root 1 -68 -187 0K 8K WAIT 14:48 2.83% irq12: fxp0 fxp1
7973 root 1 96 0 2264K 1544K RUN 0:00 0.51% top
13 root 1 -32 -151 0K 8K WAIT 5:49 0.10% swi4: clock sio
33 root 1 171 52 0K 8K pgzero 0:02 0.10% pagezero
3 root 1 -8 0 0K 8K - 0:16 0.05% g_up
1586 _tor 14 20 0 99M 97912K kserel 188:36 0.00% tor
15 root 1 -16 0 0K 8K - 1:01 0.00% yarrow
1443 root 1 -8 0 0K 8K geli:w 0:49 0.00% g_eli[0] md0
4 root 1 -8 0 0K 8K - 0:21 0.00% g_down
35 root 1 20 0 0K 8K syncer 0:17 0.00% syncer
1439 root 1 -8 0 0K 8K mdwait 0:13 0.00% md0
24 root 1 -64 -183 0K 8K WAIT 0:08 0.00% irq14: ata0
2 root 1 -8 0 0K 8K - 0:07 0.00% g_event
42 root 1 -16 0 0K 8K - 0:06 0.00% schedcpu
453 root 1 96 0 2920K 1752K select 0:05 0.00% ntpd
256 _pflogd 1 -58 0 1548K 1216K bpf 0:05 0.00% pflog
pfctls -si:
Status: Enabled for 0 days 18:37:52 Debug: Urgent
Hostid: 0x1ec3da6b
Interface Stats for fxp0 IPv4 IPv6
Bytes In 25077859159 0
Bytes Out 27498863362 0
Packets In
Passed 36192760 0
Blocked 32213 0
Packets Out
Passed 36871432 0
Blocked 265 0
State Table Total Rate
current entries 5290
searches 73567507 1096.8/s
inserts 600068 8.9/s
removals 594778 8.9/s
Counters
match 752600 11.2/s
bad-offset 0 0.0/s
fragment 102 0.0/s
short 0 0.0/s
normalize 2 0.0/s
memory 68 0.0/s
bad-timestamp 0 0.0/s
congestion 0 0.0/s
ip-option 0 0.0/s
proto-cksum 0 0.0/s
state-mismatch 12655 0.2/s
state-insert 0 0.0/s
state-limit 0 0.0/s
src-limit 2 0.0/s
synproxy
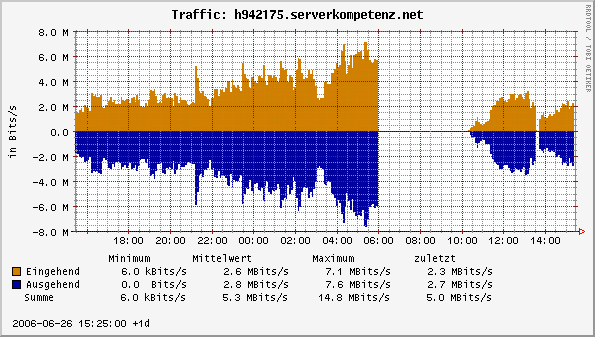
Today's traffic graph:
<http://www.fabiankeil.de/blog-surrogat/2006/06/27/tor.fabiankeil.de-dritter-ausfall-24-stunden-durchsatz-statistik-595x337.png>
(The hang around 14:00 happened while I was logged in doing a buildworld)
At the moment I'm building RELENG_6 with DDB to see if it changes anything
and if I can get a core dump, but so far the problem seems to be
similar to: http://www.freebsd.org/cgi/query-pr.cgi?pr=95180 (closed)
and <http://freebsd.rambler.ru/bsdmail/freebsd-questions_2006/msg08692.html>.
Is anyone on this list running a Tor node on FreeBSD 6.1-RELEASE
or later with similar or higher load?
Fabian
--
http://www.fabiankeil.de/
_______________________________________________
[email protected] mailing list
http://lists.freebsd.org/mailman/listinfo/freebsd-stable
To unsubscribe, send any mail to "[EMAIL PROTECTED]"