Em Fri, Mar 20, 2015 at 02:12:30PM -0700, Stephane Eranian escreveu:
> On Fri, Mar 20, 2015 at 2:07 PM, Arnaldo Carvalho de Melo
> <[email protected]> wrote:
> > Em Fri, Mar 20, 2015 at 05:39:22PM -0300, Arnaldo Carvalho de Melo escreveu:
> >> Em Fri, Mar 20, 2015 at 10:15:53AM -0700, Stephane Eranian escreveu:
> >> > On Thu, Mar 19, 2015 at 5:39 PM, Arnaldo Carvalho de Melo
> >> > <[email protected]> wrote:
> >> > > On Mar 19, 2015 9:34 PM, "Stephane Eranian" <[email protected]> wrote:
> >> > >> On Thu, Mar 19, 2015 at 3:58 PM, Arnaldo Carvalho de Melo
> >> > >> <[email protected]> wrote:
> >> > >> >         This patch, together with what is in my perf/core branch,
> >> > >> > should
> >> > >> > implement that feature we talked about recently, i.e. to allow
> >> > >> > annotating entries in callchains, please take a look at see if you
> >> > >> > think
> >> > >> > it is ok,
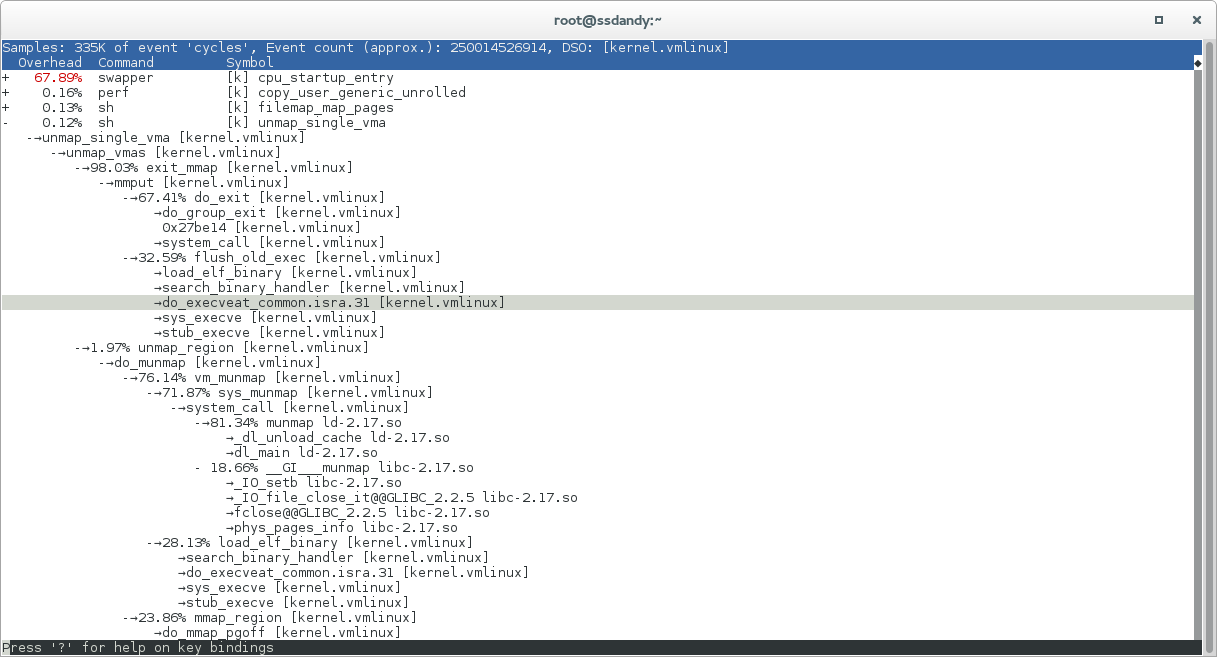
> >> > >> I tried on tip.git and a simple example. It does what I wanted.
> >> > >> I will try on more complex test cases.
> >> > >> Thanks for implementing this quickly.

> >> > > Thanks for testing, please let us know if you have further suggestions,

> >> > Ok, it does not work.
> >
> > Are you sure? I just tried, take a look at:
> >
> > http://vger.kernel.org/~acme/perf-report-annotate-callchain-entries-in-multiple-DSOs-in-the-same-hist_entry.png
> >
> > In there you will see that in the unmap_single_vma case there are
> > callchains that pass thru multiple DSOs in userspace (I used --call
> > dwarf in 'perf record') and those are marked as having
> > samples/annotation and when I go to those, pressing 'a' after moving the
> > cursor to it and it works as expected...

> > Do you have some specific example I could try?

> I tried on an example I cannot share.
> But I am guessing you could reproduce with a test which calls a libc
> or libm function
> heavily form multiple callers in the main program.
> Example:
>        -  pow()
>            50% foo() [main.c]
>            50% bar() [main.c]
>
> If I move the cursor line to foo() and annotate foo() is shows me the
> code of pow().

+   49.83%  pow-me-harder  pow-me-harder     [.] main
+   27.16%  pow-me-harder  libm-2.17.so      [.] __ieee754_pow_sse2
-   17.76%  pow-me-harder  libm-2.17.so      [.] __pow
   -→__pow libm-2.17.so
      -→80.70% main pow-me-harder
           __libc_start_main libc-2.17.so
           _start pow-me-harder
        16.82% 0x4000000000000000 unknown
        2.44% 0x1 unknown
+    2.57%  pow-me-harder  pow-me-harder     [.] pow@plt
+    2.36%  pow-me-harder  libm-2.17.so      [.] @plt
+    0.04%  pow-me-harder  [kernel.vmlinux]  [k] intel_thermal_interrupt

And if I go to the line:

-→80.70% main pow-me-harder

And press 'a' I get:

main  /home/acme/pow-me-harder
 10.25 │ 3e:   mov    -0x10(%rbp),%rax
  1.03 │       test   %rax,%rax
  4.39 │     ↓ js     53
  3.87 │       cvtsi2 %rax,%xmm3
  1.63 │       movsd  %xmm3,-0x38(%rbp)
       │     ↓ jmp    71
  0.03 │ 53:   mov    %rax,%rdx
  0.91 │       shr    %rdx
  0.29 │       and    $0x1,%eax
  1.85 │       or     %rax,%rdx
  7.38 │       cvtsi2 %rdx,%xmm0
  0.55 │       movapd %xmm0,%xmm2
  6.54 │       addsd  %xmm0,%xmm2
  0.68 │       movsd  %xmm2,-0x38(%rbp)
  1.44 │ 71:   cvtsi2 -0x4(%rbp),%xmm0
  2.82 │       movabs $0x4000000000000000,%rax
  0.62 │       mov    %rax,-0x40(%rbp)
  0.07 │       movsd  -0x40(%rbp),%xmm1
  4.30 │     → callq  pow@plt
  1.53 │       addsd  -0x38(%rbp),%xmm0
  4.13 │       ucomis 0xfd(%rip),%xmm0        # 400818 <__dso_handle+0x10>
  4.06 │     ↓ jae    a8
  1.49 │       cvttsd %xmm0,%rax
  1.49 │       mov    %rax,-0x10(%rbp)
  0.35 │     ↓ jmp    cb
       │ a8:   movsd  0xe8(%rip),%xmm1        # 400818 <__dso_handle+0x10>
  0.14 │       subsd  %xmm1,%xmm0
  2.57 │       cvttsd %xmm0,%rax
  0.66 │       mov    %rax,-0x10(%rbp)
       │       movabs $0x8000000000000000,%rax
  7.84 │       xor    %rax,-0x10(%rbp)
 16.80 │ cb:   mov    -0x10(%rbp),%rax
  2.15 │       mov    %rax,-0x10(%rbp)
       │     int main(int argc, char *argv[])
       │     {
       │             int n = atoi(argv[1]), i;
       │             unsigned long long total = 0;

While if I go to the line:

   -→__pow libm-2.17.so

And press 'a', I get:

__pow  /usr/lib64/libm-2.17.so
       │     Disassembly of section .text:
       │
       │     0000000000026290 <pow>:
       │     __pow():
       │       movapd %xmm0,%xmm2
       │       sub    $0x18,%rsp
  1.70 │       movapd %xmm1,%xmm3
 12.86 │       movsd  %xmm2,(%rsp)
       │       movsd  %xmm3,0x8(%rsp)
  2.43 │     → callq  *ABS*+0x1b110@plt
  0.49 │       movabs $0x7fffffffffffffff,%rcx
  0.28 │       movabs $0x7fefffffffffffff,%rdx
  1.01 │       movq   %xmm0,%rax
 12.58 │       and    %rcx,%rax
  2.18 │       movsd  (%rsp),%xmm2
  1.29 │       cmp    %rdx,%rax
 19.70 │       movsd  0x8(%rsp),%xmm3
  1.50 │     ↓ ja     57
  1.58 │       xorpd  %xmm1,%xmm1
 13.35 │       ucomis %xmm1,%xmm0
  0.89 │     ↓ jnp    a0
       │ 52:   add    $0x18,%rsp
 16.83 │     ← retq
       │ 57:   mov    _DYNAMIC+0x230,%rsi
       │       cmpl   $0xffffffff,(%rsi)
       │     ↑ je     52


Since I don't have glibc-debuginfo installed, I get just assembly.

[acme@ssdandy linux]$ readelf -sw /usr/lib64/libm-2.17.so | grep -w __pow
  1737: 0000000000026290   429 FUNC    LOCAL  DEFAULT   13 __pow
[acme@ssdandy linux]$

Strange, are you pressing 'V' on the main 'perf record' view, i.e. before
getting to the annotation browser, to see the DSO just after the symbol?

Trying with a deeper callchain in pow-me-harder.c...

- Arnaldo
--
To unsubscribe from this list: send the line "unsubscribe linux-kernel" in
the body of a message to [email protected]
More majordomo info at  http://vger.kernel.org/majordomo-info.html
Please read the FAQ at  http://www.tux.org/lkml/