On 22 Jun 14:14, neel patel wrote:
> Hi,

Hi,
>
> How can we merge two metrics data in a prometheus query so that grafana
> will plot it in a single graph rather than individual data.
>
> I am using the below query to plot the data in my dashboard.
>
> system_total_processes{instance=~"$host"}
> system_running_processes{instance=~"$host"}
>
> I read the PromQL docs but didn't find anything regarding merging 2 metrics
> So how to merge both above metrics using a single query so that we can get
> the data with 2 rows. Any pointers will be appreciated?
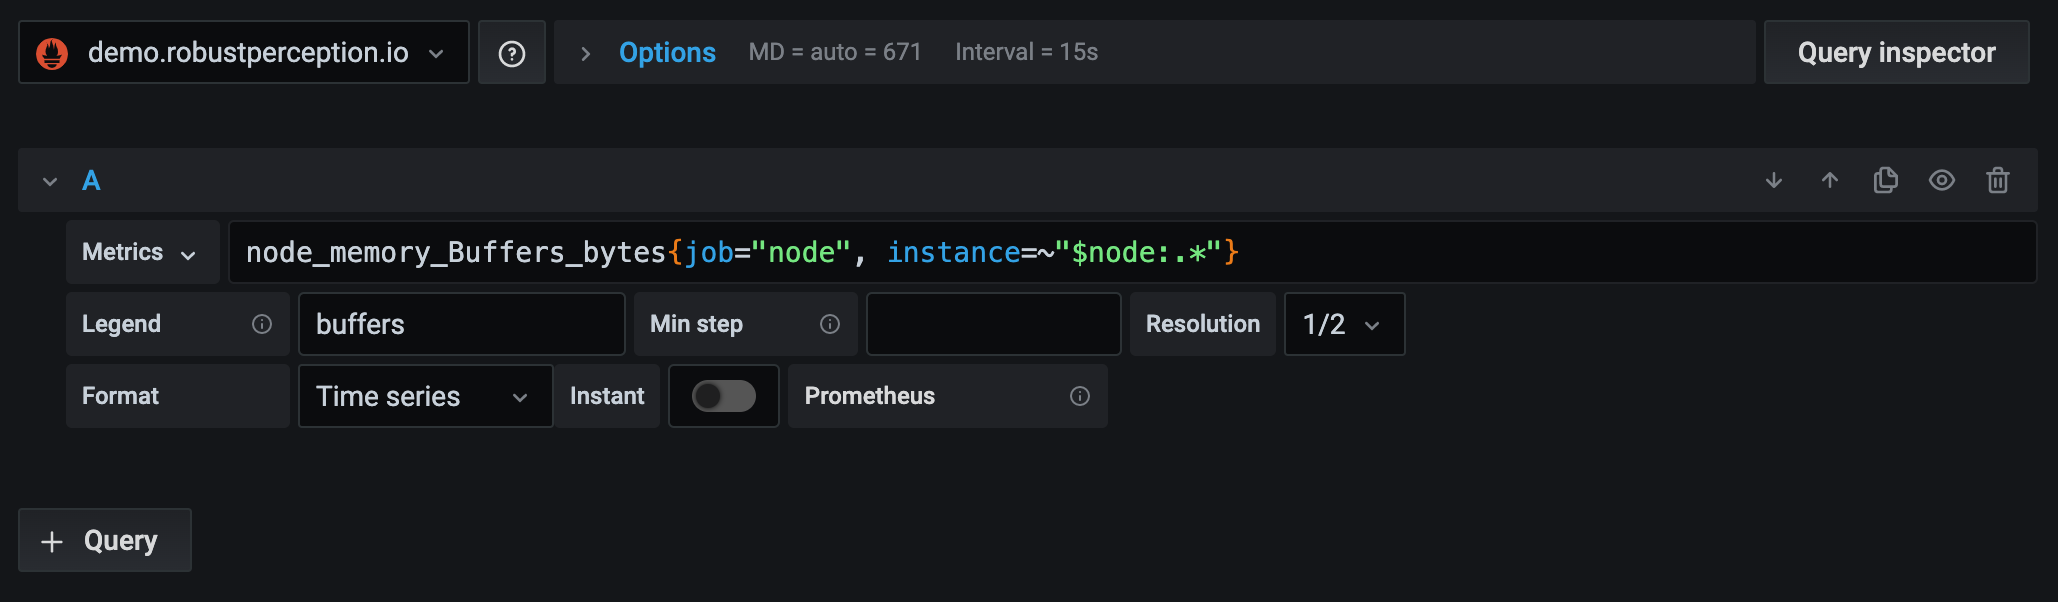
You are looking into adding multiple queries in Grafana. Grafana
supports up to 26 queries per panel.
Look for + Query button:
https://grafana.com/static/img/docs/queries/prometheus-query-editor-7-0.png
regards,
>
> Thanks in Advance
>
> --
> You received this message because you are subscribed to the Google Groups
> "Prometheus Users" group.
> To unsubscribe from this group and stop receiving emails from it, send an
> email to [email protected].
> To view this discussion on the web visit
> https://groups.google.com/d/msgid/prometheus-users/CAPTvBtvbn0wqTnnLKEFrik3fVMu1LOzeOs1rNEaUBi3fpi8wXg%40mail.gmail.com.
--
Julien Pivotto
@roidelapluie
--
You received this message because you are subscribed to the Google Groups
"Prometheus Users" group.
To unsubscribe from this group and stop receiving emails from it, send an email
to [email protected].
To view this discussion on the web visit
https://groups.google.com/d/msgid/prometheus-users/20200622084710.GA196956%40oxygen.