Hi Julien,

Yes, you are right. Thanks for your input. Appreciated.
Thanks,
Neel Patel
On Mon, Jun 22, 2020 at 2:17 PM Julien Pivotto <roidelapl...@prometheus.io>
wrote:
> On 22 Jun 14:14, neel patel wrote:
> > Hi,
>
> Hi,
>
> >
> > How can we merge two metrics data in a prometheus query so that grafana
> > will plot it in a single graph rather than individual data.
> >
> > I am using the below query to plot the data in my dashboard.
> >
> > system_total_processes{instance=~"$host"}
> > system_running_processes{instance=~"$host"}
> >
> > I read the PromQL docs but didn't find anything regarding merging 2
> metrics
> > So how to merge both above metrics using a single query so that we can
> get
> > the data with 2 rows. Any pointers will be appreciated?
>
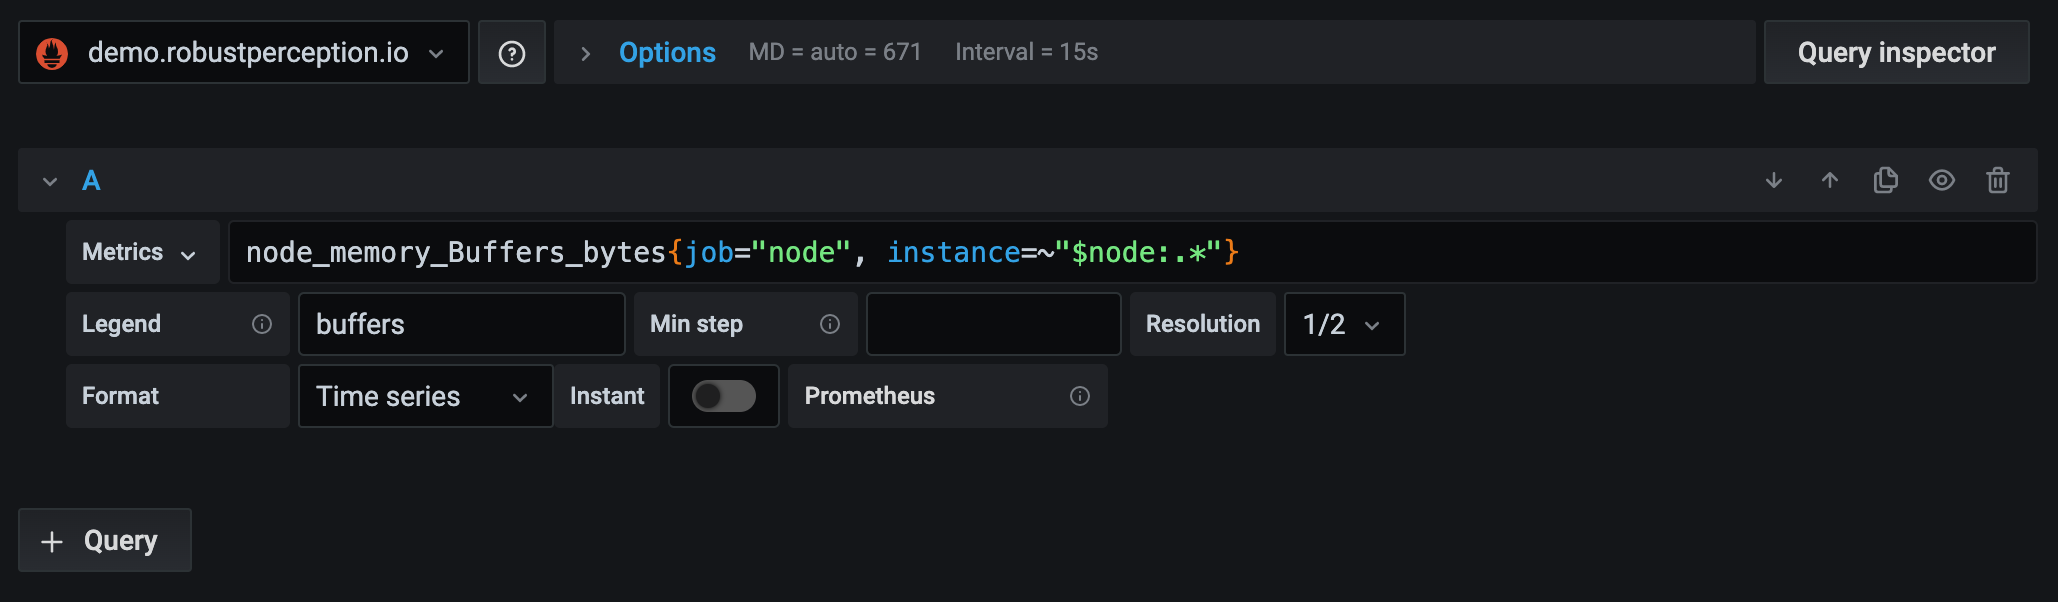
> You are looking into adding multiple queries in Grafana. Grafana
> supports up to 26 queries per panel.
>
> Look for + Query button:
> https://grafana.com/static/img/docs/queries/prometheus-query-editor-7-0.png
>
>
> regards,
>
>
> >
> > Thanks in Advance
> >
> > --
> > You received this message because you are subscribed to the Google
> Groups "Prometheus Users" group.
> > To unsubscribe from this group and stop receiving emails from it, send
> an email to prometheus-users+unsubscr...@googlegroups.com.
> > To view this discussion on the web visit
> https://groups.google.com/d/msgid/prometheus-users/CAPTvBtvbn0wqTnnLKEFrik3fVMu1LOzeOs1rNEaUBi3fpi8wXg%40mail.gmail.com
> .
>
> --
> Julien Pivotto
> @roidelapluie
>
--
You received this message because you are subscribed to the Google Groups
"Prometheus Users" group.
To unsubscribe from this group and stop receiving emails from it, send an email
to prometheus-users+unsubscr...@googlegroups.com.
To view this discussion on the web visit
https://groups.google.com/d/msgid/prometheus-users/CAPTvBttWtGoNV14SbSDnKEVxwJu3uEo0sRHEXc3Loj7mtyfomg%40mail.gmail.com.