Hi,

I am trying to learn to use ggplot2 for what I had hoped would be a
fairly simple task.  I have a relatively small data.frame (100 by 4).
The first column contains symbols.  The 2nd, 3rd and 4th columns
represent percentage weightings for each symbol using 3 different
methodologies.  For example:
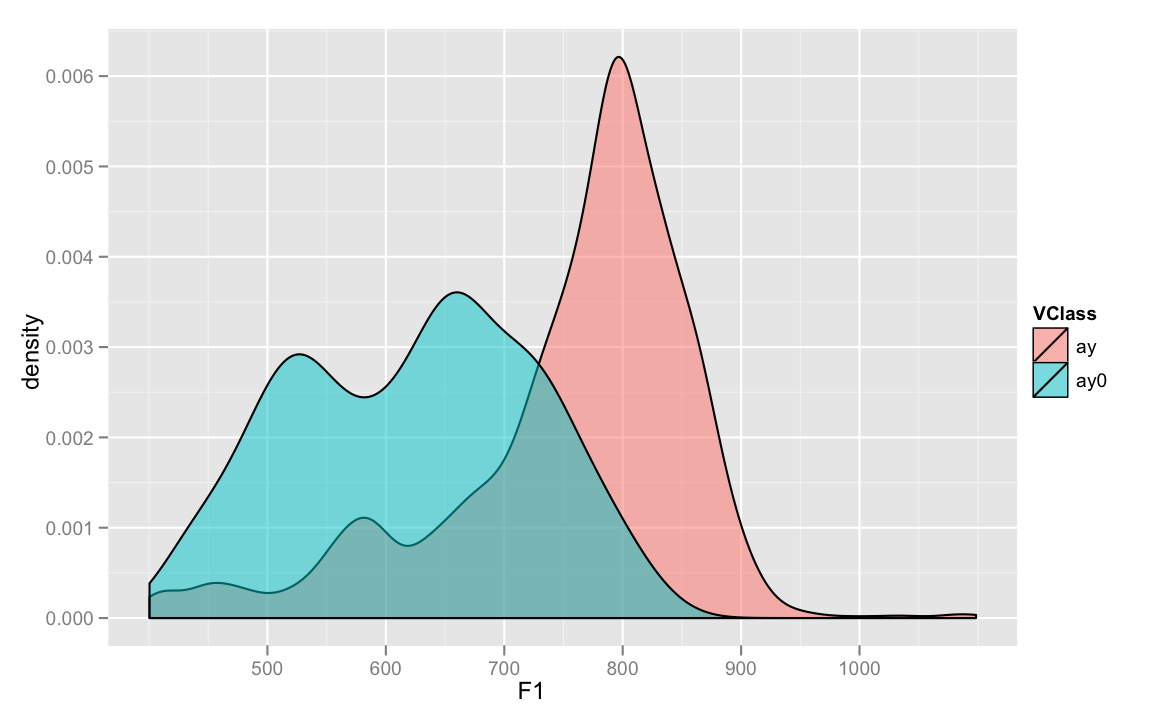
sym <- make.unique(replicate(100, paste(sample(LETTERS, 3, replace =
TRUE), collapse = "")))
x1 <- sort(rexp(100) * 1000000, decreasing = TRUE)
x2 <- sort(rexp(100) * 1000000, decreasing = TRUE)
x3 <- sort(rexp(100) * 1000000, decreasing = TRUE)

x <- data.frame(cbind(Symbol = sym, x1/sum(x1), x2/sum(x2),
x3/sum(x3)), stringsAsFactors = FALSE)

I'd like to plot a line for each of the 3 different methodologies.
The y-axis would be percentage weight, the x-axis would be the symbol
or row number, although I'd prefer that not to be shown.
Aesthetically, I'd like the plot to look like this one (except with 3
lines), although I believe that's not the proper kind of plot for my
data:

http://www.ling.upenn.edu/~joseff/rstudy/plots/ggplotintro/densityidentity.png
http://www.ling.upenn.edu/~joseff/rstudy/summer2010_ggplot2_intro.html

Is there a way to do this with my data?  From what I've been reading,
I get the sense that my data might be in the wrong format for what I'm
trying to do.  I've tried experimenting with melt to reformat my data,
but have gotten nowhere. I've tried a number of different ways to try
to get this working.  Most of the time, I don't even get any output.
The closest I've gotten is this simple command, but the output is
terrible.

ggplot(x, aes(Symbol, c(V2,V3,V4))) + geom_line()

I think I'm just completely misunderstanding the syntax of ggplot.
Could someone please point me in the right direction?  Thank you.

James

______________________________________________
R-help@r-project.org mailing list
https://stat.ethz.ch/mailman/listinfo/r-help
PLEASE do read the posting guide http://www.R-project.org/posting-guide.html
and provide commented, minimal, self-contained, reproducible code.