Justin,

Thanks for your help.
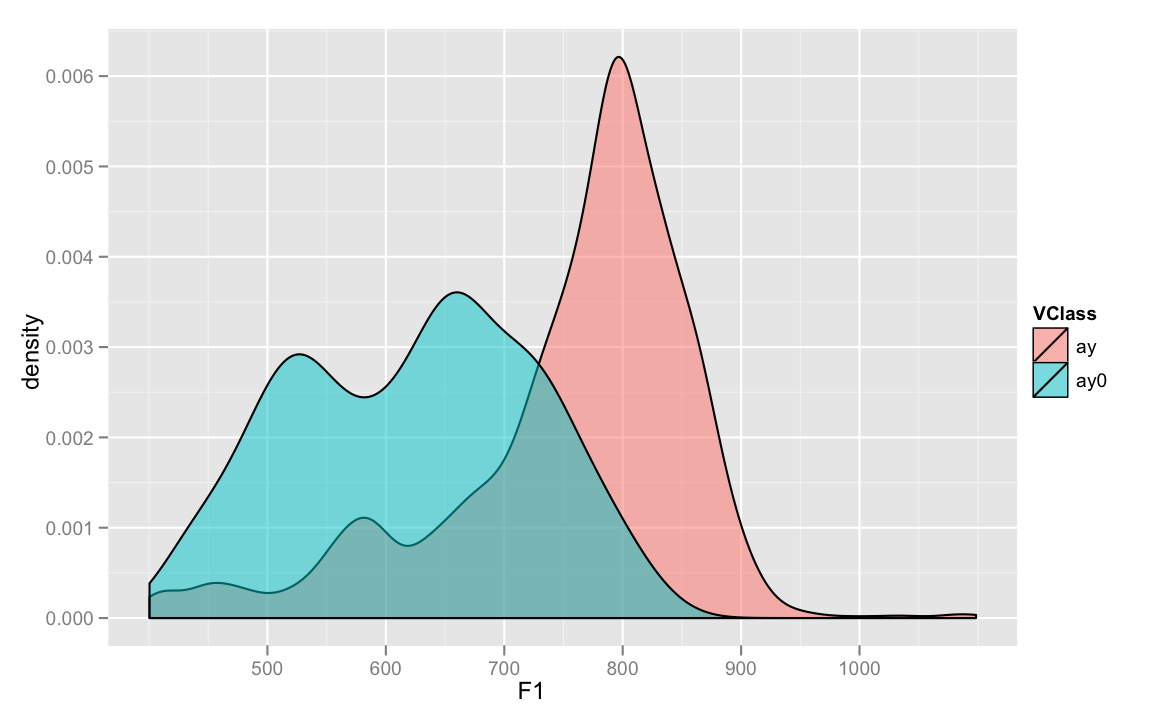
On Mon, Sep 12, 2011 at 2:19 PM, Justin Haynes <jto...@gmail.com> wrote:
>
> the data you've given is all character vectors!

Yes, I'm sorry about that.  I should not have used cbind when forming
my data.frame.  It changed my numeric data to character.  This command
would have been better.

x <- data.frame(Symbol = sym, X1 = x1/sum(x1), X2 = x2/sum(x2), X3 =
x3/sum(x3), stringsAsFactors = FALSE)

>> library(ggplot2)
>> x.melt<-melt(x,id.vars='Symbol')
>
> now, i think what you're looking for looks like:
>
>> ggplot(x.melt, aes(x=1:100, y=value, colour=variable)) + geom_line()

Yes, that's 90% of what I was looking for.  The rest is just formatting.


> but I'm not totally sure.  You aren't misunderstanding the syntax per say,
> but are asking it to plot a factor along the x-axis.  the behaviour of
> geom_line in that case is not what you are expecting.  you have a density
> value at each point but a categorical variable along the x-axis, so you cant
> draw a continuous line through them, they are discrete.
>
> the plot you reference uses more data and does the density calculation
> internally:
>
>> dat<-data.frame(x.var=rnorm(1000),cat.var=rep(letters[1:4],250))
>> ggplot(dat,aes(x=x.var,colour=cat.var))+geom_density()
>
> let me know if this helps or if you would like further explanation.

Thanks so much for the help.  It's much easier understanding when I
can see an example with my own data.  I'll keep working to get the
more custom formatting of the example plot.

Thank you,

James


> On Mon, Sep 12, 2011 at 11:43 AM, J Toll <jct...@gmail.com> wrote:
>>
>> Hi,
>>
>> I am trying to learn to use ggplot2 for what I had hoped would be a
>> fairly simple task.  I have a relatively small data.frame (100 by 4).
>> The first column contains symbols.  The 2nd, 3rd and 4th columns
>> represent percentage weightings for each symbol using 3 different
>> methodologies.  For example:
>>
>> sym <- make.unique(replicate(100, paste(sample(LETTERS, 3, replace =
>> TRUE), collapse = "")))
>> x1 <- sort(rexp(100) * 1000000, decreasing = TRUE)
>> x2 <- sort(rexp(100) * 1000000, decreasing = TRUE)
>> x3 <- sort(rexp(100) * 1000000, decreasing = TRUE)
>>
>> x <- data.frame(cbind(Symbol = sym, x1/sum(x1), x2/sum(x2),
>> x3/sum(x3)), stringsAsFactors = FALSE)
>>
>> I'd like to plot a line for each of the 3 different methodologies.
>> The y-axis would be percentage weight, the x-axis would be the symbol
>> or row number, although I'd prefer that not to be shown.
>> Aesthetically, I'd like the plot to look like this one (except with 3
>> lines), although I believe that's not the proper kind of plot for my
>> data:
>>
>>
>> http://www.ling.upenn.edu/~joseff/rstudy/plots/ggplotintro/densityidentity.png
>> http://www.ling.upenn.edu/~joseff/rstudy/summer2010_ggplot2_intro.html
>>
>> Is there a way to do this with my data?  From what I've been reading,
>> I get the sense that my data might be in the wrong format for what I'm
>> trying to do.  I've tried experimenting with melt to reformat my data,
>> but have gotten nowhere. I've tried a number of different ways to try
>> to get this working.  Most of the time, I don't even get any output.
>> The closest I've gotten is this simple command, but the output is
>> terrible.
>>
>> ggplot(x, aes(Symbol, c(V2,V3,V4))) + geom_line()
>>
>> I think I'm just completely misunderstanding the syntax of ggplot.
>> Could someone please point me in the right direction?  Thank you.
>>
>> James
>>
>> ______________________________________________
>> R-help@r-project.org mailing list
>> https://stat.ethz.ch/mailman/listinfo/r-help
>> PLEASE do read the posting guide
>> http://www.R-project.org/posting-guide.html
>> and provide commented, minimal, self-contained, reproducible code.
>
>

______________________________________________
R-help@r-project.org mailing list
https://stat.ethz.ch/mailman/listinfo/r-help
PLEASE do read the posting guide http://www.R-project.org/posting-guide.html
and provide commented, minimal, self-contained, reproducible code.