The XYZ to RGB conversion is already in convertColor(), and also in the
colorspace package.
      -thomas


On Sun, 15 Mar 2009, baptiste auguie wrote:
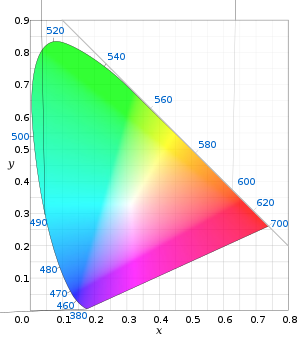
I've put together a rough R port of that C code [*] in a package on r-forge:

http://r-forge.r-project.org/plugins/scmsvn/viewcvs.php/pkg/spectral/?root=photonics
http://r-forge.r-project.org/R/?group_id=160 ( package spectral, will be built overnight )There is a lot of optimization and cleaning to do: it seems much slower than it should be, and the documentation is empty at the moment, but it reproduces the result for the black body radiation.library(spectral) data(wavelength) data(cie_colour_match) data(colourSystem) test <- function(bbTemp=5000){ mxyz <- spectrum_to_xyz(specfun=bb_spectrum, bbTemp=bbTemp) rgb <- xyz_to_rgb(colourSystem[3, ], mxyz) norm_rgb(constrain_rgb(rgb)) } temperatures <- seq(1000, 10000, by=500) # temperatures <- seq(1000, 10000, length=300) res <- abs(sapply(temperatures, test)) grid.newpage() start <- seq(0.1, 0.9, length=dim(res)[2]) end <- start + mean(diff(start)) grid.segments(x0=start,x1=end, y0=0*start+0.5, y1=0*temperatures+0.5, gp=gpar(col=rgb(res[1, ], res[2, ], res[3, ], alpha=1), lwd=10, lineend=3))Best wishes, baptiste [*] from http://www.fourmilab.ch/documents/specrend/ On 14 Mar 2009, at 12:33, baptiste auguie wrote:Hi,For a good discussion of the link between colour and spectra I would suggest,http://www.fourmilab.ch/documents/specrend/which provides an open-source C code to perform the conversion you ask for. I asked for some advice on how to wrap a R function around this code last week but sadly I didn't get anywhere. Do let me know if you succeed. (alternatively, one could port the implementation in pure R as the code is not too complicated or computationally demanding).Hope this helps, baptiste On 14 Mar 2009, at 12:09, Jinsong Zhao wrote:Hi there, I try to plot visible light spectrum (380nm~780nm) with color corresponding to the specific wavelength. However, I don't find a function that could do this. Another question, it's possible to plot a color space chromaticity diagram like this: http://upload.wikimedia.org/wikipedia/commons/thumb/0/02/CIExy1931.svg/300px-CIExy1931.svg.png Thanks in advance! Jinsong ______________________________________________ R-help@r-project.org mailing list https://stat.ethz.ch/mailman/listinfo/r-helpPLEASE do read the posting guide http://www.R-project.org/posting-guide.htmland provide commented, minimal, self-contained, reproducible code._____________________________ Baptiste Auguié School of Physics University of Exeter Stocker Road, Exeter, Devon, EX4 4QL, UK Phone: +44 1392 264187 http://newton.ex.ac.uk/research/emag ___________________________________________________________ Baptiste Auguié School of Physics University of Exeter Stocker Road, Exeter, Devon, EX4 4QL, UK Phone: +44 1392 264187 http://newton.ex.ac.uk/research/emag ______________________________________________ R-help@r-project.org mailing list https://stat.ethz.ch/mailman/listinfo/r-help PLEASE do read the posting guide http://www.R-project.org/posting-guide.html and provide commented, minimal, self-contained, reproducible code.
Thomas Lumley                   Assoc. Professor, Biostatistics
tlum...@u.washington.edu        University of Washington, Seattle

______________________________________________
R-help@r-project.org mailing list
https://stat.ethz.ch/mailman/listinfo/r-help
PLEASE do read the posting guide http://www.R-project.org/posting-guide.html
and provide commented, minimal, self-contained, reproducible code.