Github user echarles commented on the pull request:
https://github.com/apache/incubator-zeppelin/pull/702#issuecomment-182615851
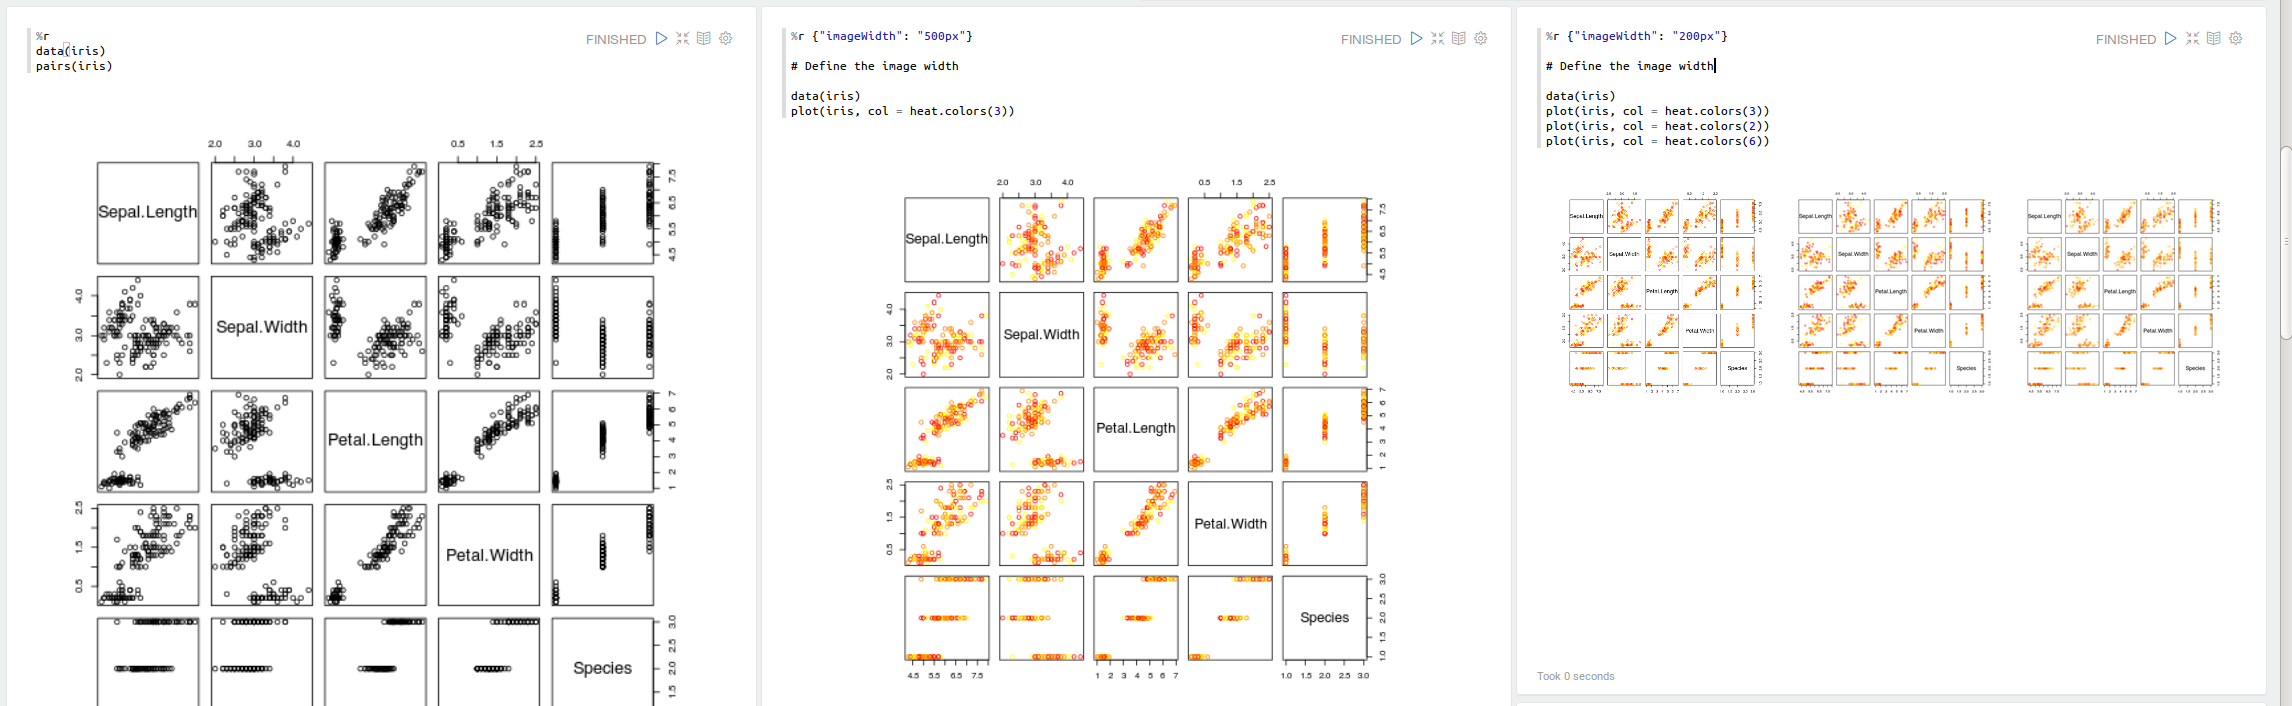
Last commit brings the ability to define the ggplot2 image size as asked on
https://github.com/datalayer/zeppelin-R/issues/2
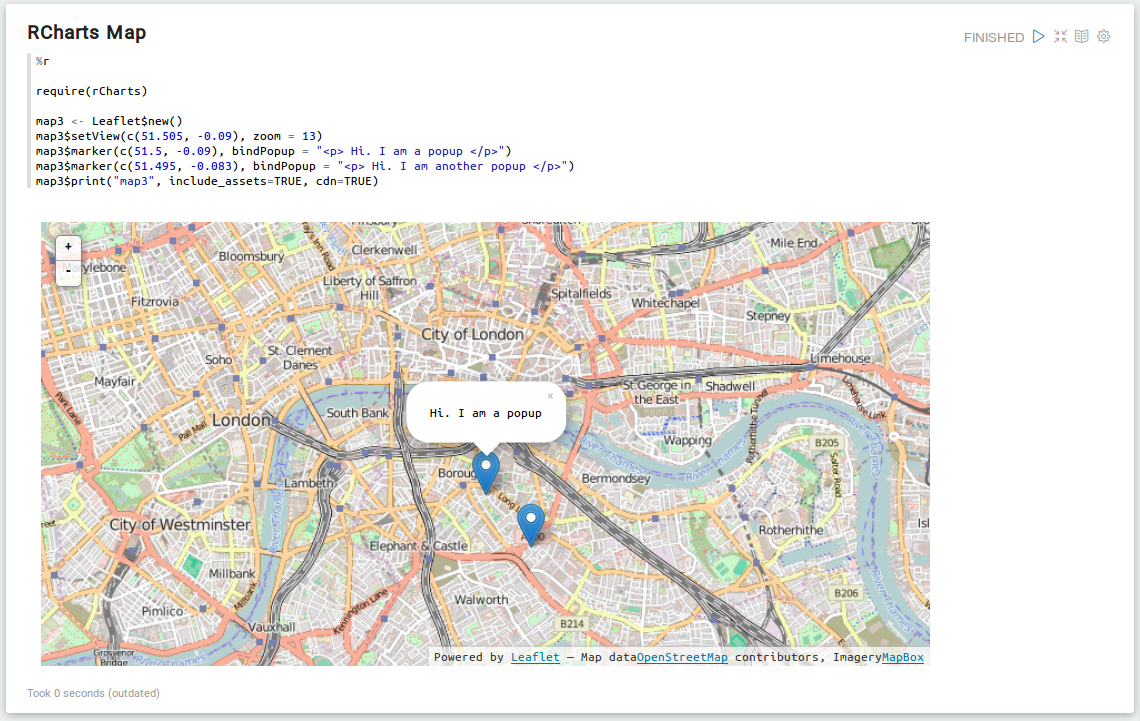
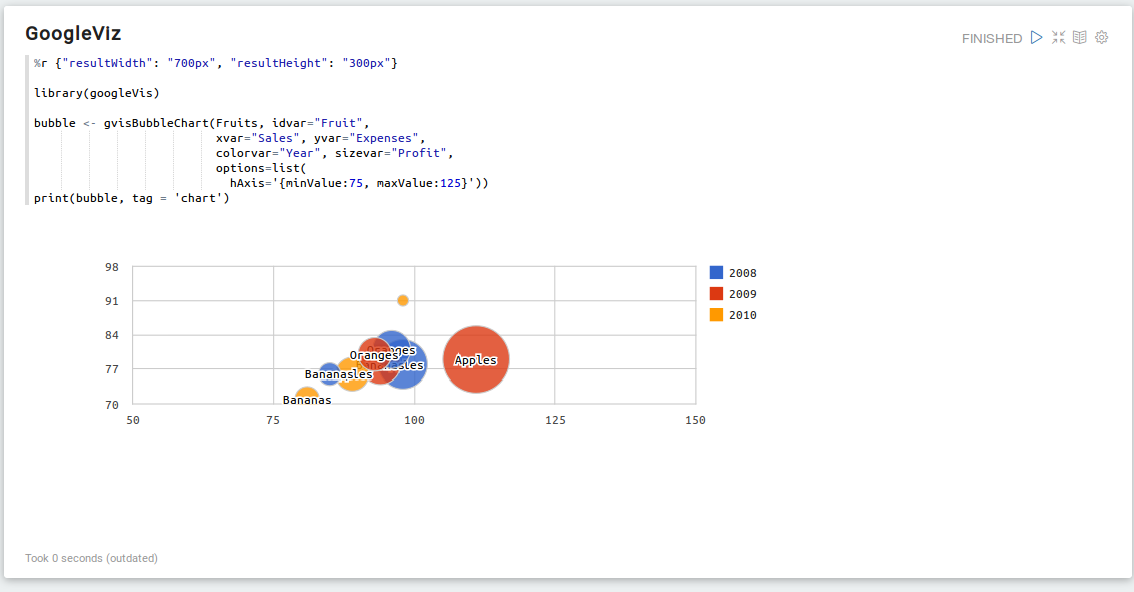
I have also added more samples on interactive visualization.
[](https://raw.githubusercontent.com/datalayer/zeppelin-R/rscala/_Rimg/ggplot2.png)
[](https://raw.githubusercontent.com/datalayer/zeppelin-R/rscala/_Rimg/rcharts.png)
[](https://raw.githubusercontent.com/datalayer/zeppelin-R/rscala/_Rimg/rcharts-map.png)
[](https://raw.githubusercontent.com/datalayer/zeppelin-R/rscala/_Rimg/googlevis.png)
---
If your project is set up for it, you can reply to this email and have your
reply appear on GitHub as well. If your project does not have this feature
enabled and wishes so, or if the feature is enabled but not working, please
contact infrastructure at [email protected] or file a JIRA ticket
with INFRA.
---