Dear forum,

I am using Paraview to visualise a large dataset coming from a direct
simulation of turbulence (size of the original data of order 10-100GB).
Naturally, I am running in parallel on a cluster (using the mesa), which
also works very well.
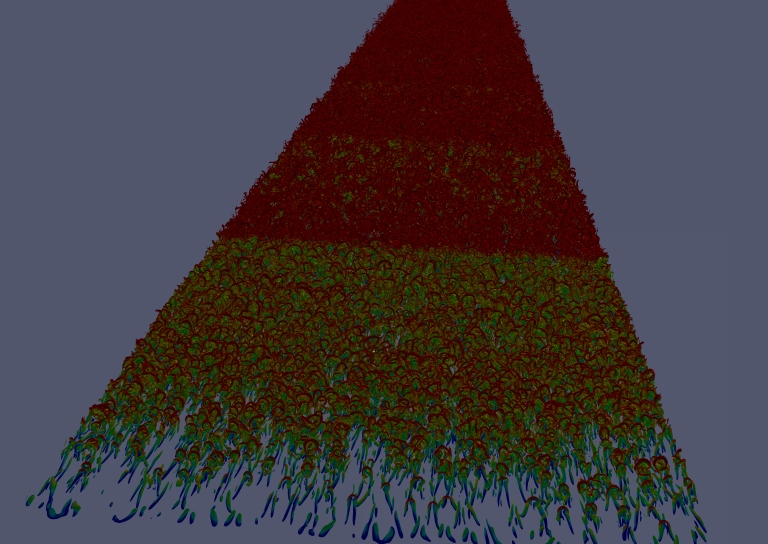
However, there is one issue: I want to visualise isosurfaces of a quantity,
and colour them using another scalar quantity. When running serial,
everything is fine. When using multiple processors with MPI leading to the
data being distributed, the rendering of the isosurfaces is still ok.
However, the colouring seems to be based on the scalar field of the first
data segment (i.e. the first processor) only. This then leads to very
visible boundaries between the processors as the colours are clearly not
correct (see example on
http://www.mech.kth.se/~pschlatt/files/resampled.jpg). Again, running on a
single processor everything is correct, and running on different numbers of
processors will shift the edges.

This issue could be confirmed in all version up to 3.10.

Due to this, I am required to run in serial, which is very painful both due
to memory requirements and very long rendering times (up to 15 minutes for a
single frame). Thus, if there would be a simple fix, I'd be very interested.

Thanks a lot in advance for any hint.
Best regards,
Philipp Schlatter
KTH Mechanics, Stockholm, Sweden

_______________________________________________
Powered by www.kitware.com

Visit other Kitware open-source projects at
http://www.kitware.com/opensource/opensource.html

Please keep messages on-topic and check the ParaView Wiki at:
http://paraview.org/Wiki/ParaView

Follow this link to subscribe/unsubscribe:
http://www.paraview.org/mailman/listinfo/paraview