Hi Philipp,

It seems you have hit a bug in the Contour filter occurring with > 1
pvserver process and rectilinear grid input. I can reproduce the issue
you reported as such:
Load ParaView, connect to > 1 pvserver processes
Open Data/RectGrid2.vtk (e.g. from git://vtk.org/VTKData.git)
Calculator filter, operation: "coordsX",
Result Array Name: "Result", Apply
Contour filter, Contour by "scalars", Compute Normals,
Isosurface Value 0.5, Apply
Representation "Surface", Color by "Result"
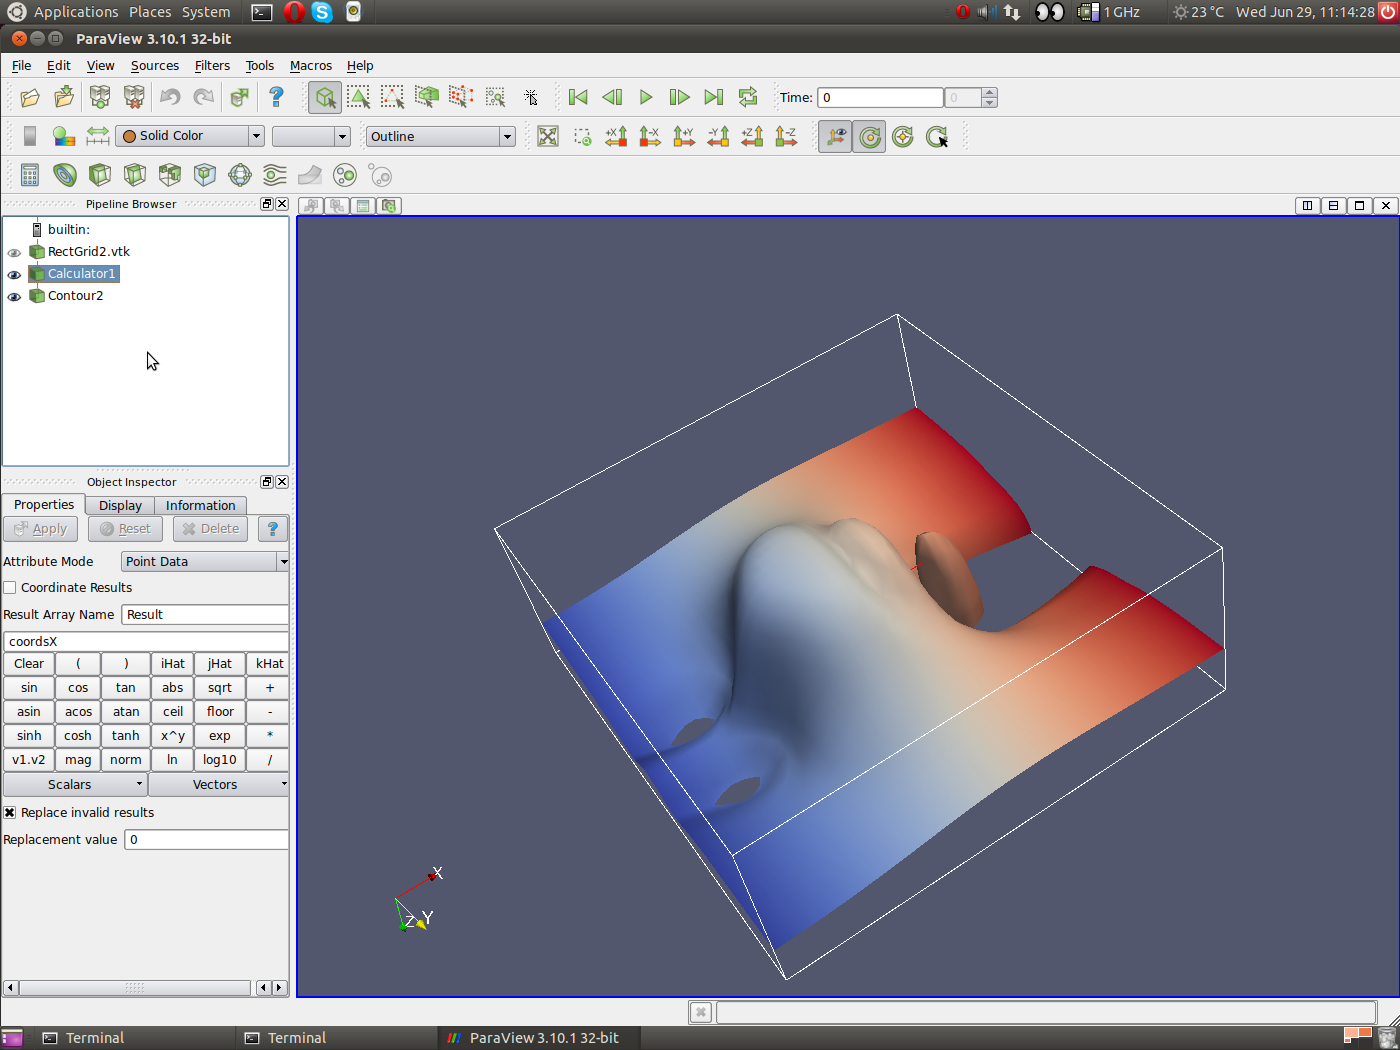
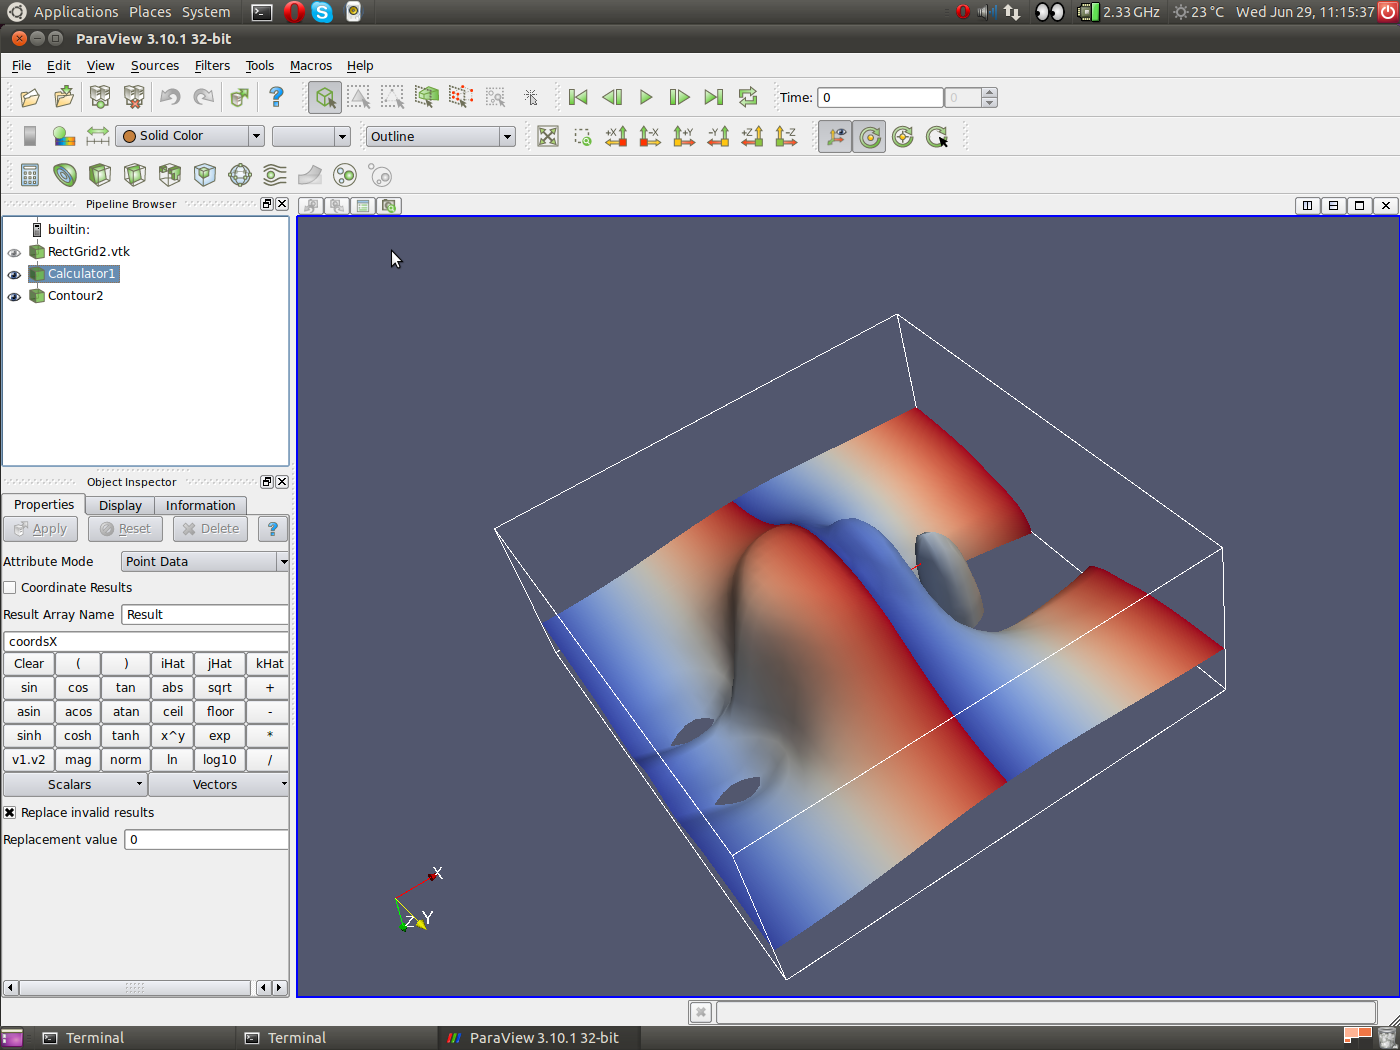
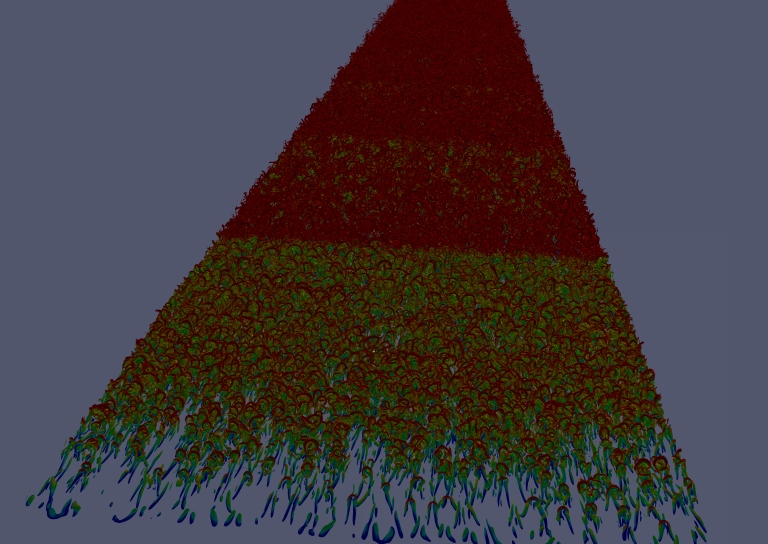
With 1 pvserver process the surface coloring is indeed a single smooth
gradient while with more than 1 pvserver process the gradient starts
anew at half the X range. If applying an additional "Process ID Scalars"
filter, one can confirm that the "reset" happens at a process boundary.
Converting the rectilinear grid to an unstructured grid prior to
applying the contour filter may serve as as a workaround. The filters
"Clean to Grid", "Tetrahedralize" and "Tesselate" all do that trick
(they are listed with increasing memory footprint). So, I recommend
using "Clean to Grid" somewhere before applying the contour filter in
the parallel case.
Karl
Philipp Schlatter wrote, On 29.06.2011 11:50:
> Hi!
> Thanks for the answer. Let me give some comments to your questions:
> - I am using the distributed 3.10.1 binaries (32 bit), and I tried it on
> a Ubuntu 11.04 system (older dualcore T60p)
> - I used now the sample dataset Data/RectGrid2.vtk. Using the calculator
> operation "CoordsX", I can reproduce the behaviour I was originally
> describing. I simply use the Contour filter ("Compute Scalars" did not
> change the behaviour). I have uploaded 3 more screenshots:
>
>
> http://www.mech.kth.se/~pschlatt/files/Screenshot3.png
> is the intended result, obtained using a single core (no Auto-MPI etc.)
>
> http://www.mech.kth.se/~pschlatt/files/Screenshot2.png
> is the result obtained with Auto-MPI, running on my two cores.
>
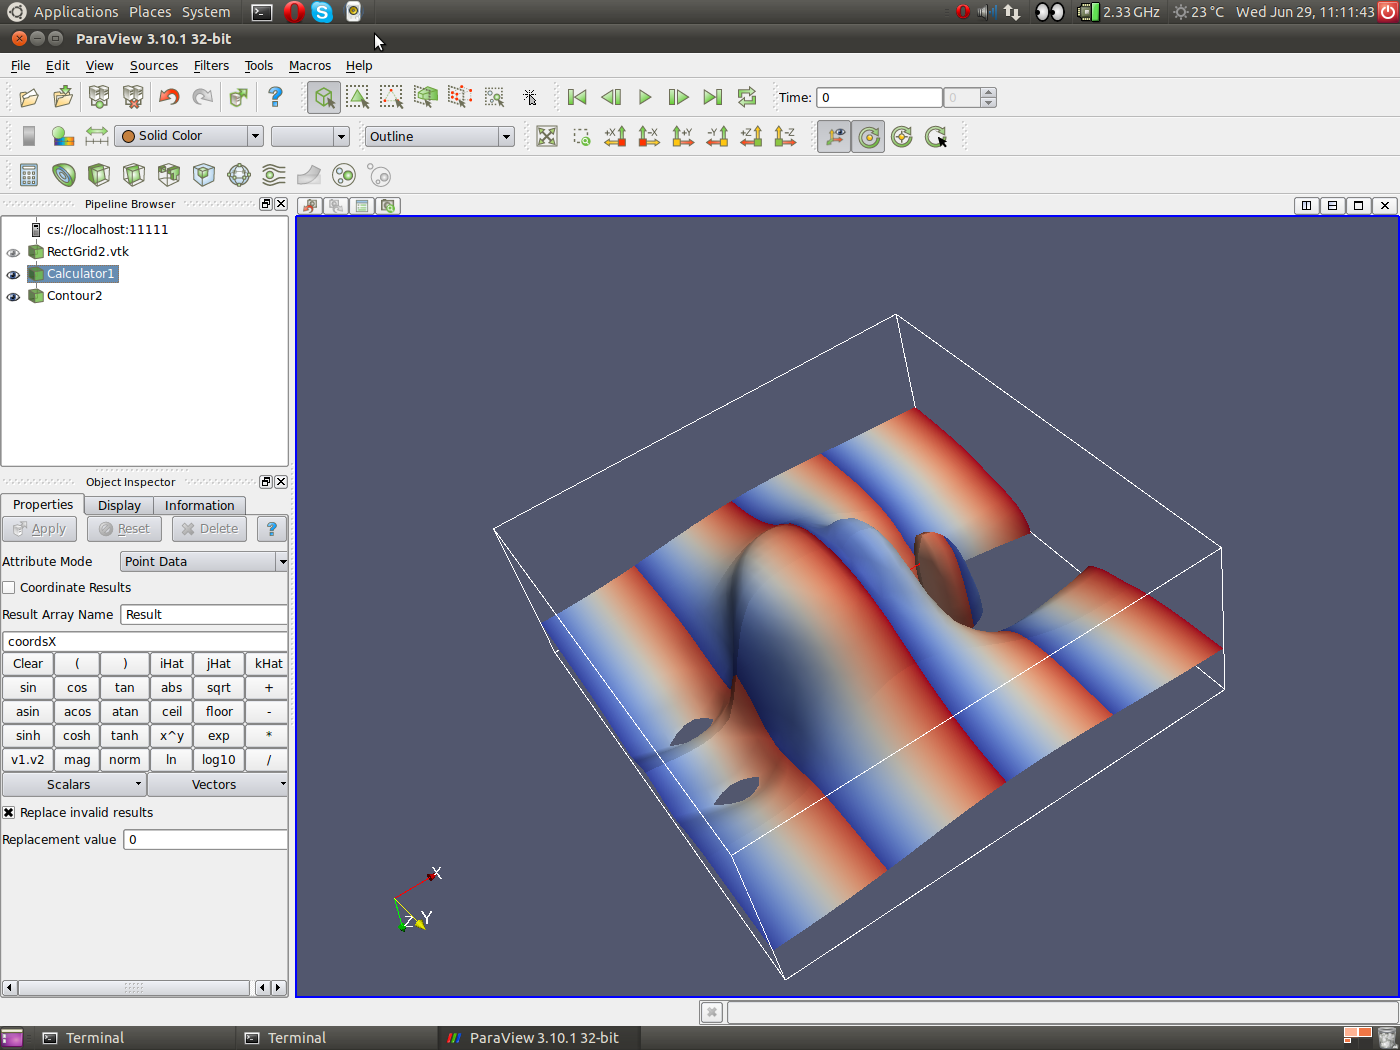
> http://www.mech.kth.se/~pschlatt/files/Screenshot1.png
> is the result obtained with explicitly initiating paraview and pvserver
> using a total of 16 MPI ranks.
>
> I tried all/most of the rendering options (LOD etc.), however it did not
> help. Also, I have run on 64 bit version at the computer centre (with
> older versions though), and the same problem appears there too.
>
> I am really puzzled by the fact that you could not reproduce the
> problem. Could there be some setting that is for some reason wrong in my
> setup?
>
> Best regards,
> Philipp
>
>
> On Tue, 28 Jun 2011 18:36:25 +0200, Karl König <kkoeni...@web.de> wrote:
>
>> Hi Philipp,
>>
>> A couple of questions:
>> * Are you using the distributed 3.10.1 binaries or did you compile PV
>> 3.10.1 from source yourself?
>> * Can you reproduce the behavior with the sample dataset
>> Data/RectGrid2.vtk (part of both git://vtk.org/VTKData.git and
>> http://www.paraview.org/files/v3.10/ParaViewData-3.10.1.zip)? That's
>> also a "Rectilinear Grid". Using the Calculator operation "1 +
>> coordsX*coordsY" followed by a Contour filter with "Compute Scalars"
>> checked and 10 auto-chosen values, I got identical results with 1 and 16
>> cores (using PV 3.10.1 Linux 64-bit binaries and Windows 64-bit
>> binaries, relying on Auto-MPI ("Settings" - "Use Multi-Core") for the 16
>> core case)
>>
>> Karl
>>
>>
>> Philipp Schlatter wrote, On 28.06.2011 17:50:
>>> Dear all,
>>> Unfortunately, I am still struggling with running MPI and producing
>>> coloured
>>> isosurfaces. A screenshot exemplifying the problem can be found at
>>> http://www.mech.kth.se/~pschlatt/files/Screenshot.png; note that the
>>> colour
>>> scheme based on the x-coordinate is just to show the problem, but in
>>> reality
>>> I am using some scalar data coming from file.
>>>
>>> Anyway, I wanted to ask you whether any of you has had similar problems,
>>> i.e. colouring isosurfaces when running MPI. It seems to me that the
>>> data
>>> field used to colour the surfaces is only created on one MPI rank and
>>> then
>>> used by all other ranks, instead of computed for each rank independently
>>> based on the local data. Can anyone confirm that behaviour?
>>>
>>> This problem makes it at the moment impossible for me to visualise a
>>> certain
>>> very large data set as I need to use MPI to distribute the data due to
>>> memory limitation.
>>>
>>> Thanks a lot for any help!
>>>
>>> Philipp
>>>
>>> -----Original Message-----
>>> From: Philipp Schlatter [mailto:pschl...@mech.kth.se]
>>> Sent: den 20 juni 2011 22:55
>>> To: 'Utkarsh Ayachit'
>>> Cc: paraview@paraview.org
>>> Subject: RE: [Paraview] FW: Coloured isosurfaces when running MPI
>>>
>>> Dear Utkarsh,
>>> Thanks a lot for your answer. The type of my data is "Rectilinear Grid"
>>> (turbulence data on a regular grid). The test case that I use to
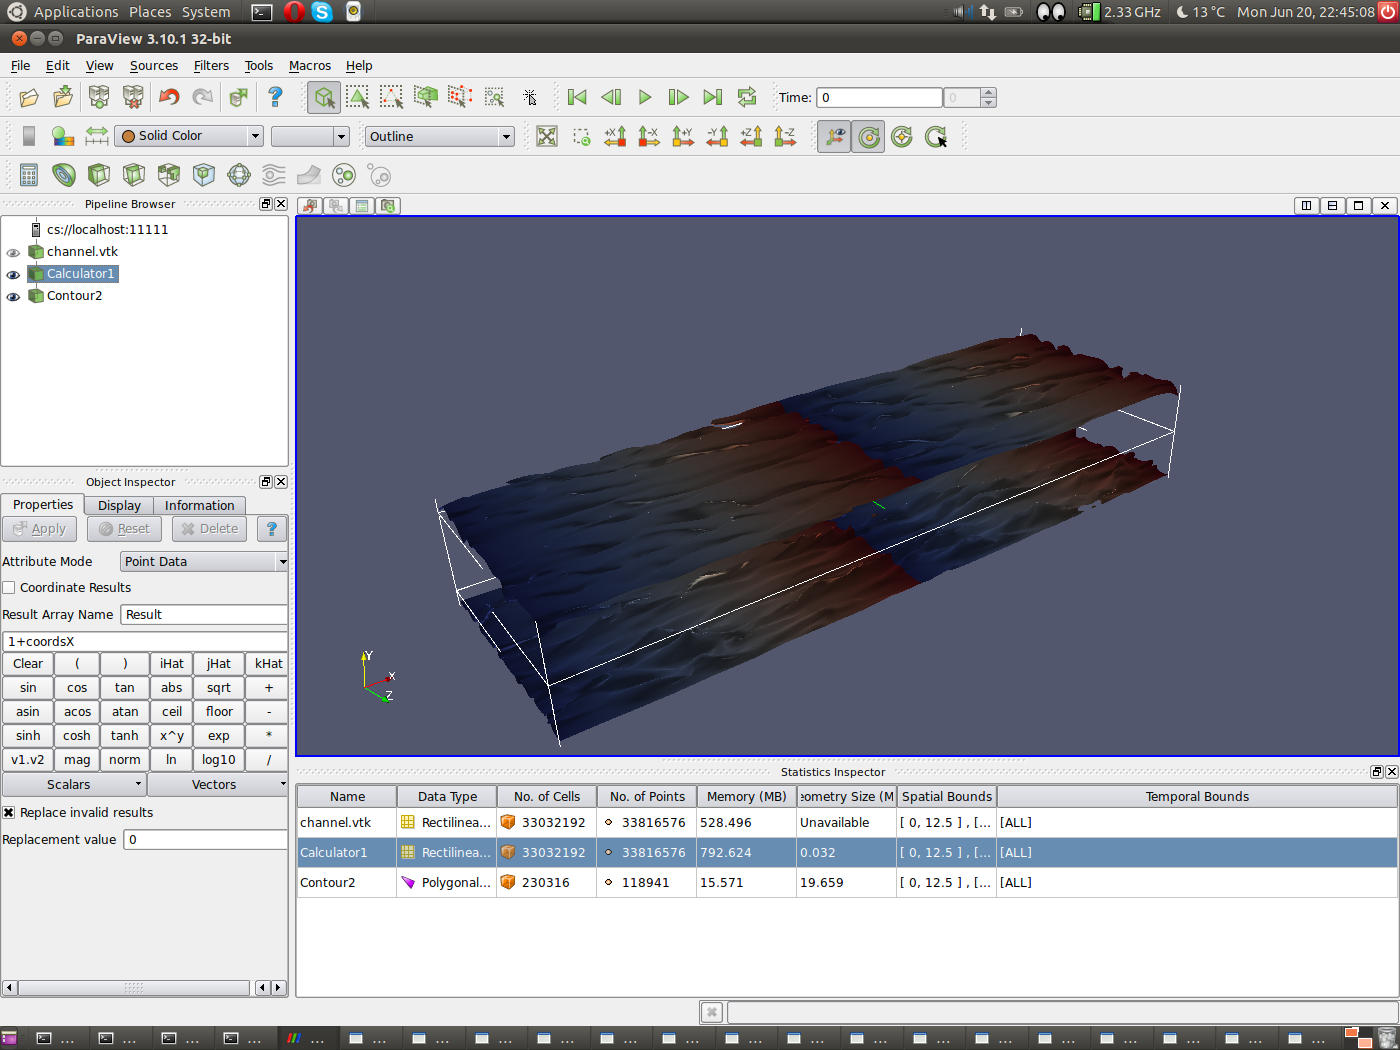
>>> reproduce
>>> the data leads to a size of the contours (from the statistics inspector)
>>> 230316 cells, and a memory of 15 MB. I have turned off all the remote
>>> render
>>> thresholds etc. and the problem persists. Thus it is likely that it
>>> is the
>>> contour filter that causes the miscolouring.
>>>
>>> I have just reroduced the problem using the latest version 3.10.1 (Linux
>>> 32-bit); and I generated a screenshot on
>>> http://www.mech.kth.se/~pschlatt/files/Screenshot.png.
>>>
>>> The test is simple; I read in a rectilinear grid with a few velocity
>>> components. Then I compute a new scalar field, essentially being the
>>> x-corrdinate. Then I plot an isocontour, and colour it with the
>>> result of
>>> the calculator. I would expect a continuous colour going from blue to
>>> red
>>> spread over the whole x extent, however - according to the number of
>>> processors used (in that case 16) - I get a repetitive pattern. By
>>> some more
>>> experimenting it becomes clear that for some reason the colouring is
>>> done
>>> based on the scalar value on the first processor only.
>>>
>>> Running on 1 processor everything is fine.
>>>
>>> I am of course happy to provide the respective data files, if this could
>>> help.
>>>
>>> Thanks for any help!
>>> Best regards,
>>> Philipp
>>>
>>>
>>> -----Original Message-----
>>> From: Utkarsh Ayachit [mailto:utkarsh.ayac...@kitware.com]
>>> Sent: den 20 juni 2011 16:59
>>> To: Philipp Schlatter
>>> Cc: paraview@paraview.org
>>> Subject: Re: [Paraview] FW: Coloured isosurfaces when running MPI
>>>
>>> That's very peculiar. What datatype are you contouring? (With the reader
>>> selected in the pipeline browser, go to the information tab, what
>>> does the
>>> "Type" field say?) Also after generating the iso-surface, open the
>>> statistics inspector (View | Statistics Inspector). What is the size
>>> of the
>>> geometry generated from the contour filter. If that's not too large,
>>> you
>>> try doing local-rendering (go to Edit | Settings, on the Server page,
>>> uncheck Remote Render Threshold). Does that help? This will help
>>> diagnose if
>>> the issue is with rendering or with the data generated by the contour
>>> filter
>>> itself.
>>>
>>> Utkarsh
>>>
>>> On Sun, Jun 19, 2011 at 11:25 AM, Philipp Schlatter
>>> <pschl...@mech.kth.se>
>>> wrote:
>>>> Dear forum,
>>>>
>>>> I am using Paraview to visualise a large dataset coming from a direct
>>>> simulation of turbulence (size of the original data of order 10-100GB).
>>>> Naturally, I am running in parallel on a cluster (using the mesa),
>>>> which also works very well.
>>>>
>>>> However, there is one issue: I want to visualise isosurfaces of a
>>>> quantity, and colour them using another scalar quantity. When running
>>>> serial, everything is fine. When using multiple processors with MPI
>>>> leading to the data being distributed, the rendering of the
>>>> isosurfaces is
>>> still ok.
>>>> However, the colouring seems to be based on the scalar field of the
>>>> first data segment (i.e. the first processor) only. This then leads to
>>>> very visible boundaries between the processors as the colours are
>>>> clearly not correct (see example on
>>>> http://www.mech.kth.se/~pschlatt/files/resampled.jpg). Again, running
>>>> on a single processor everything is correct, and running on different
>>>> numbers of processors will shift the edges.
>>>>
>>>> This issue could be confirmed in all version up to 3.10.
>>>>
>>>> Due to this, I am required to run in serial, which is very painful
>>>> both due to memory requirements and very long rendering times (up to
>>>> 15 minutes for a single frame). Thus, if there would be a simple
>>>> fix, I'd
>>> be very interested.
>>>>
>>>> Thanks a lot in advance for any hint.
>>>> Best regards,
>>>> Philipp Schlatter
>>>> KTH Mechanics, Stockholm, Sweden
_______________________________________________
Powered by www.kitware.com
Visit other Kitware open-source projects at
http://www.kitware.com/opensource/opensource.html
Please keep messages on-topic and check the ParaView Wiki at:
http://paraview.org/Wiki/ParaView
Follow this link to subscribe/unsubscribe:
http://www.paraview.org/mailman/listinfo/paraview