Hi Tudor.
This is clearer now. Let me rewrite my concern so you can have a better
understanding. I have been reviewing the Roassal code and resulted very
clear to me how to get a visualization by scripting.
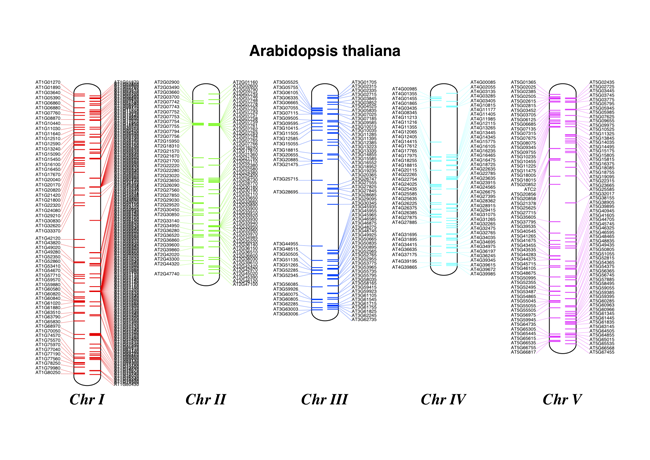
But I am afraid that you would get better feedback from scientists using
MATLAB, R and similar software every day. Most of them, I presume, didn't
hear about Smalltalk or Moose. Having a more directed bridge to attract
them would pay off. See for example what people is doing behind the
University of Florida
http://www2.research.att.com/~yifanhu/gallery/indexAll.html (first hit for
"visualizing big matrices" in Google). They're using MATLAB,
Rutherford/Boeing and MatrixMarket formats
http://www.cise.ufl.edu/research/sparse/matrices/

Please don't get me wrong, I am not asking you or anyone to implement such
layer. I am saying it would be nice to have more Smalltalkers to build
these missing pieces. What can we do about it?

BTW I've just found another inspirational picture for the relation tower:

http://biopython.org/DIST/docs/tutorial/images/tRNA_chrom.png

Cheers,

Hernán


2013/12/27 Tudor Girba <tu...@tudorgirba.com>

> Hi,
>
> I think there is a little confusion here.
>
> I meant to say that Roassal allows you to map your whatever objects onto a
> visualization. How you do this mapping is completely up to you. If you have
> a million objects, you will have to do some preprocessing yourself. That is
> all. There really is no magic involved. I just like to use "transformation"
> as a term in order to point out that visualization is no different than any
> other object manipulation.
>
> Did I address your concern?
>
> Cheers,
> Doru
>
>
>
>
> On Thu, Dec 26, 2013 at 9:48 PM, Hernán Morales Durand <
> hernan.mora...@gmail.com> wrote:
>
>> Hi Tudor,
>> Thanks for the clarification.
>> Can you comment or point a link for the mechanism to transform my data
>> for Roassal? Because if you want to visualize big data like population or
>> association studies input is sometimes millions of rows. Of course I am not
>> asking you to write my parsers :)
>>
>> Cheers,
>>
>> Hernán
>>
>>
>>
>>
>> 2013/12/26 Tudor Girba <tu...@tudorgirba.com>
>>
>>> Hi Hernán,
>>>
>>> The input should be independent from the visualization engine. Roassal
>>> offers you a way of transforming your objects into a visualization and it
>>> should not be responsible for the input formats.
>>>
>>> Cheers,
>>> Doru
>>>
>>>
>>> On Thu, Dec 26, 2013 at 9:28 PM, Hernán Morales Durand <
>>> hernan.mora...@gmail.com> wrote:
>>>
>>>> Hi Alexandre and Ricardo,
>>>>
>>>> I am glad to see your advances in Roassal visualization!
>>>> I wonder which input formats do you plan to support?
>>>>
>>>> Your relation tower can be used to visualize the crossover percentages
>>>> between haplotype blocks. For example, here are some Haplotypes drawings
>>>> from Haploview (http://en.wikipedia.org/wiki/Haploview) which may
>>>> interest you:
>>>>
>>>>
>>>> http://www.jnsbm.org/viewimage.asp?img=JNatScBiolMed_2012_3_2_139_101887_f13.jpg
>>>> from this paper
>>>> http://www.jnsbm.org/temp/JNatScBiolMed32139-5367486_145434.pdf
>>>>
>>>> http://www.mailund.dk/wp-content/uploads/2010/04/haplotypes.png
>>>>
>>>> http://www.mailund.dk/wp-content/uploads/2010/04/journal.pone_.0010207.g005.png
>>>>
>>>> I can send you the exported haplotypes from a study if you are
>>>> interested. It contains 131 blocks which is somewhat big to attach to this
>>>> list. The only problem I see is that a parser is needed to parse the
>>>> Haplotype text output file, although the format should not be difficult to
>>>> parse.
>>>>
>>>> Cheers,
>>>>
>>>> Hernán
>>>>
>>>>
>>>>
>>>>
>>>>
>>>>
>>>>
>>>> 2013/12/17 Alexandre Bergel <alexandre.ber...@me.com>
>>>>
>>>>> Hi!
>>>>>
>>>>> A new builder for Roassal is coming… The goal of Relation tower is to
>>>>> easily visualize relations between group of elements. We had the
>>>>> inspiration from the following website http://peoplemov.in/#!
>>>>>
>>>>> Here are some screenshots:
>>>>>
>>>>> https://www.facebook.com/media/set/?set=a.559114290841839.1073741837.340543479365589&type=3
>>>>>
>>>>> If you like these screenshots, then you know where the like button is
>>>>> :-)
>>>>>
>>>>> We will have this visualization on the web, thanks to our smooth and
>>>>> nice Pharo2Amber migration process.
>>>>>
>>>>> Any idea on how to extend/apply Relation tower? Any set of data you
>>>>> want us to play with? Your data?
>>>>> Feedback are very welcome!
>>>>>
>>>>> Cheers,
>>>>> Ricardo & Alexandre
>>>>>
>>>>> --
>>>>> _,.;:~^~:;._,.;:~^~:;._,.;:~^~:;._,.;:~^~:;._,.;:
>>>>> Alexandre Bergel  http://www.bergel.eu
>>>>> ^~:;._,.;:~^~:;._,.;:~^~:;._,.;:~^~:;._,.;:~^~:;.
>>>>>
>>>>>
>>>>>
>>>>
>>>
>>>
>>> --
>>> www.tudorgirba.com
>>>
>>> "Every thing has its own flow"
>>>
>>
>>
>
>
> --
> www.tudorgirba.com
>
> "Every thing has its own flow"
>