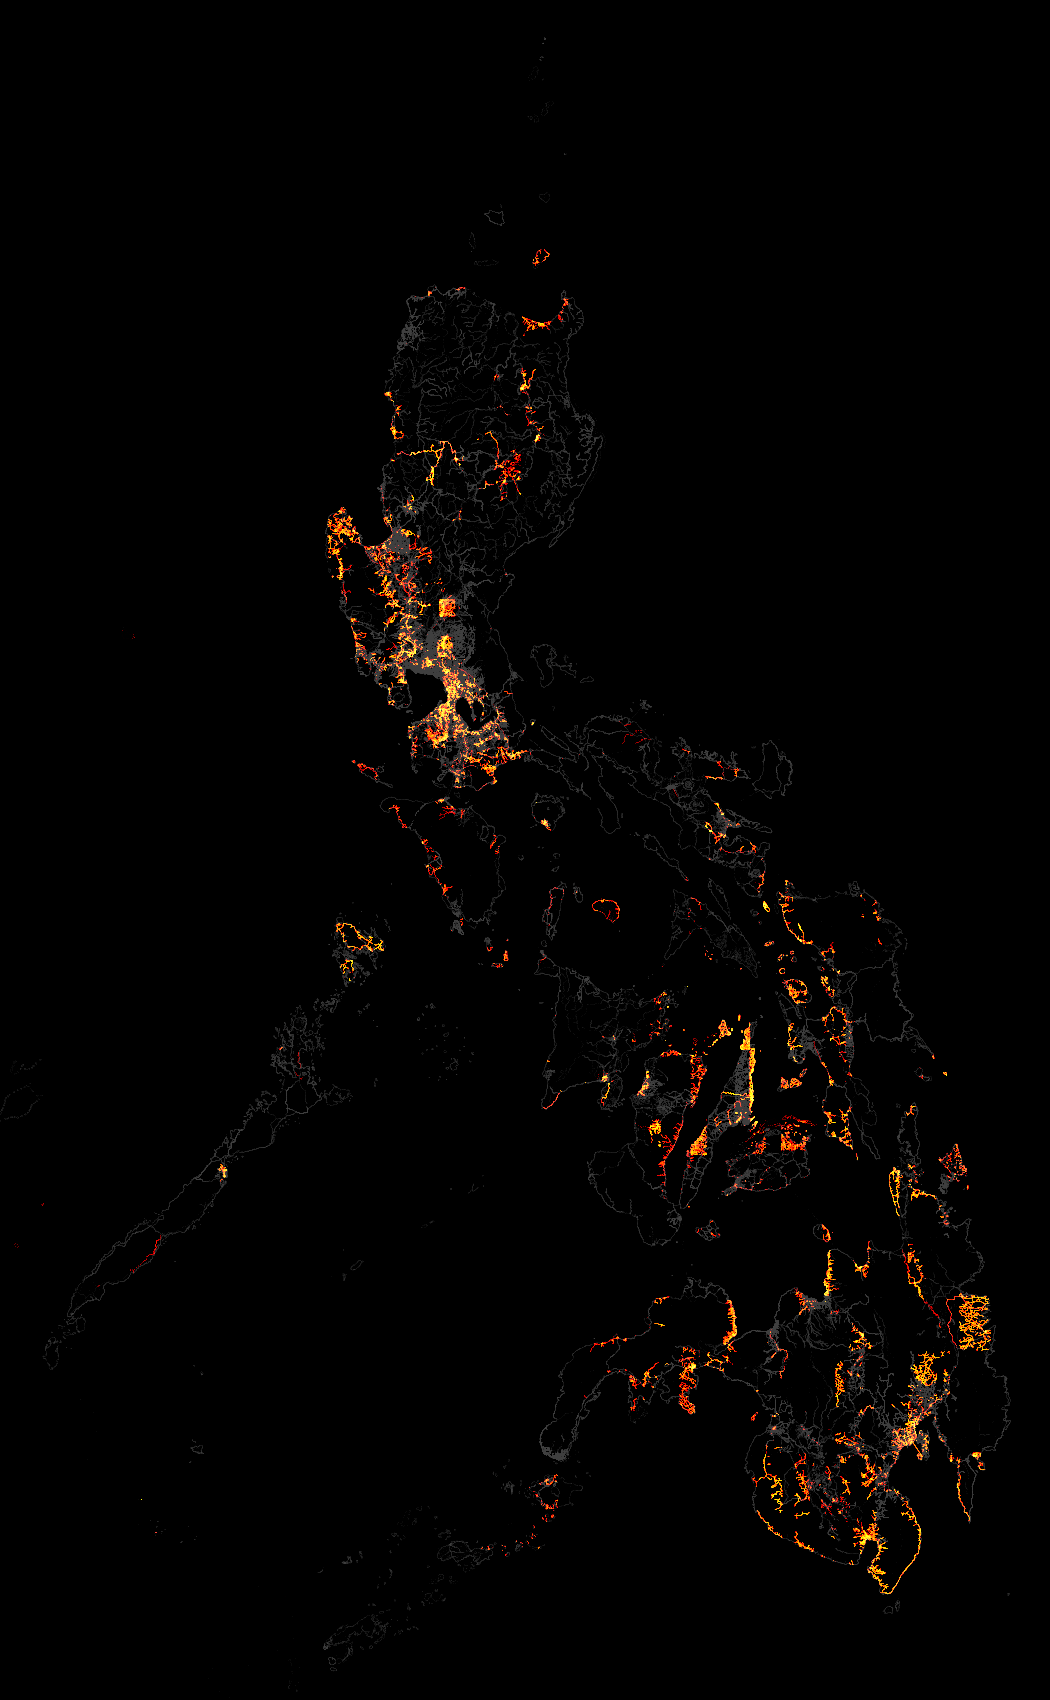
Hi guys,

I made a follow-up to the node density visualization I shared back in
March. This time, the map shows the node increase compared to the data
of the original map. Similar to before, brighter pixels represent
areas with higher node count increases. Gray pixels show the original
data as a baseline.
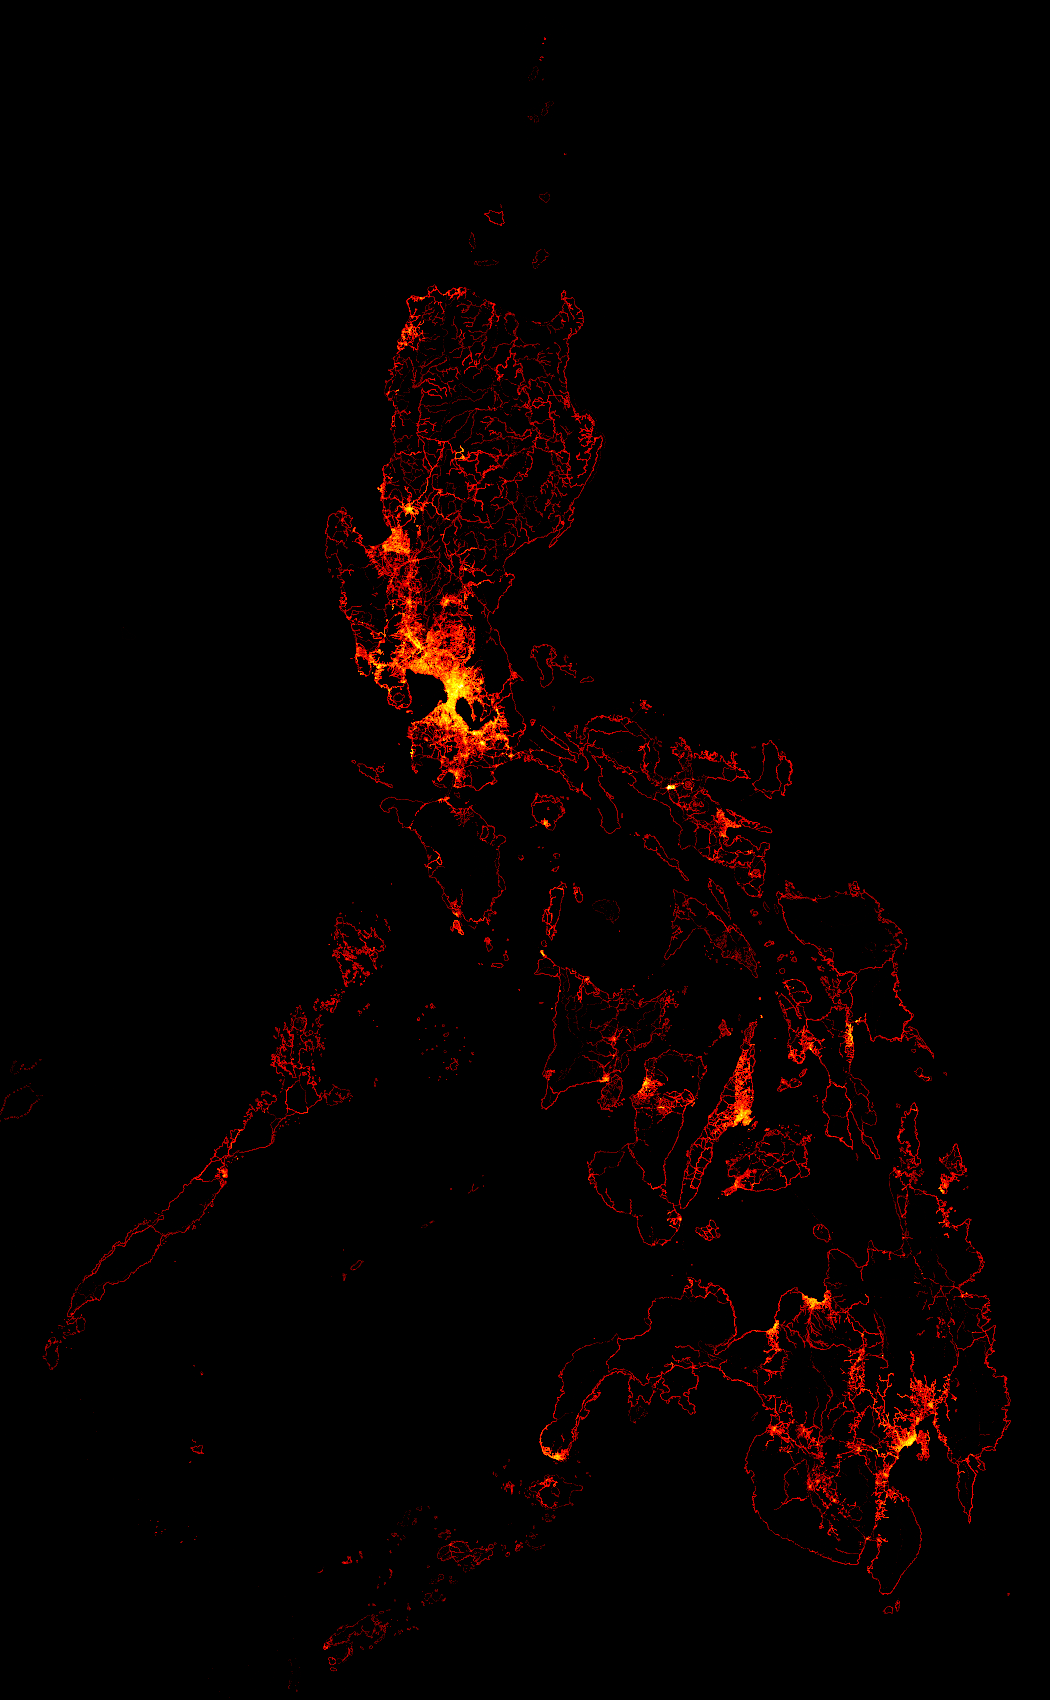
You can view it here:
http://wiki.openstreetmap.org/w/images/5/56/Philippines_node_density_increase_from_2012-01-02_to_2012-06-03.png

For comparison here's the original map:
http://wiki.openstreetmap.org/w/images/8/81/Philippines_node_density_2012-01-02.png

Take note that this is not a map of editing activity! It only merely
shows node density increases. (So if someone deleted a node in an area
and another one created a node, there will be no change in the node
counts.) But this visualization does somewhat indicate where new data
is being added.

It's nice to see that most parts of the Philippines have seen an
increase in data. You can see the obvious effect of the new Bing
imagery that was released back in February as bright rectangular
areas.

Nice work everyone! Let's keep it up! :-)

Eugene


On Sat, Feb 25, 2012 at 8:38 PM, Eugene Alvin Villar <sea...@gmail.com> wrote:
> Correction, that should be 0.01°, not 0.1°. :-)
>
> On 2/25/12, Eugene Alvin Villar <sea...@gmail.com> wrote:
>> Hi guys,
>>
>> I created a visualization showing the node density of OSM data in the
>> Philippines taken from the 2012-01-02 Geofabrik extract. Each pixel
>> represents a 0.1°×0.1° degree square or approximately 1 square
>> kilometer. Brighter pixels represent areas with higher node counts.
>>
>> View it here:
>> http://wiki.openstreetmap.org/w/images/8/81/Philippines_node_density_2012-01-02.png
>>
>> The edges of available satellite imagery at that time is quite visible
>> in some areas like Pangasinan, Cebu, Bukidnon, and Davao del Sur. As
>> expected, brighter areas are places where there is a large amount of
>> editing and with a large population.
>>
>> By the way, can you guess which place has the densest concentration of
>> nodes (the only purely white pixel in the image)? It's in Naga City
>> and this is due to the Naga City import. The second densest location
>> is in Marikina, and this is thanks to maning's efforts in mapping all
>> of the buildings in his adopted city. :-)
>>
>> Eugene

_______________________________________________
talk-ph mailing list
talk-ph@openstreetmap.org
http://lists.openstreetmap.org/listinfo/talk-ph