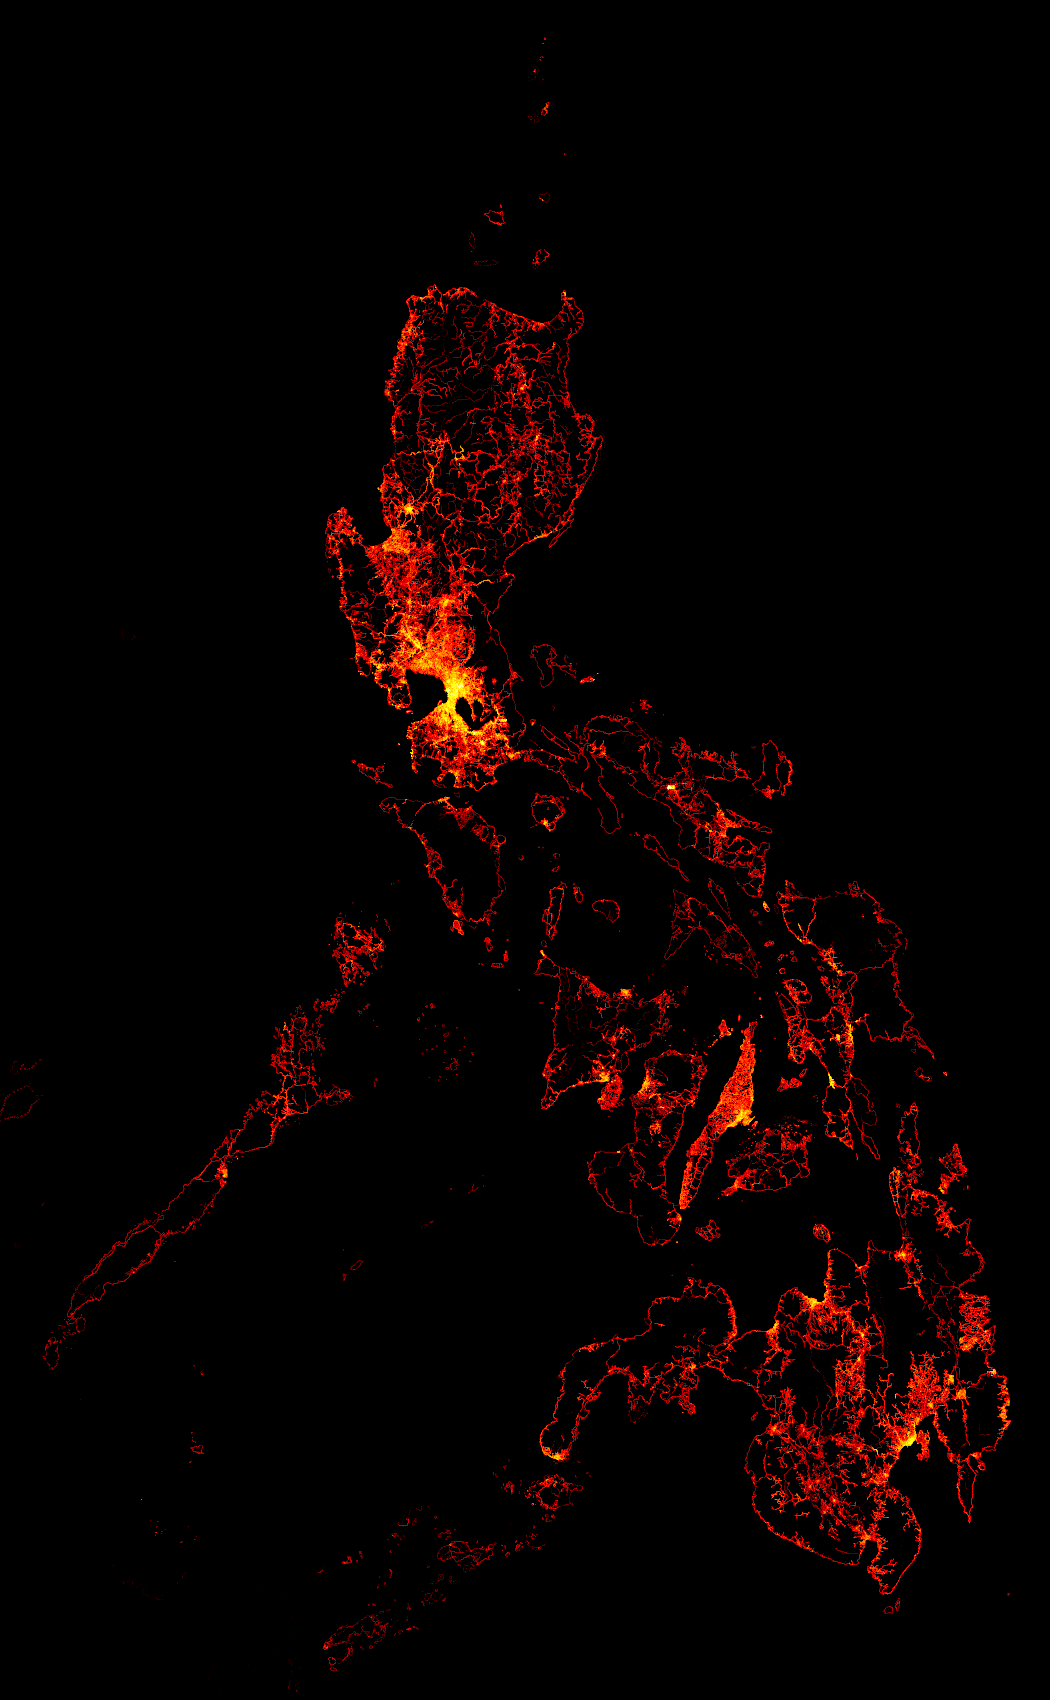
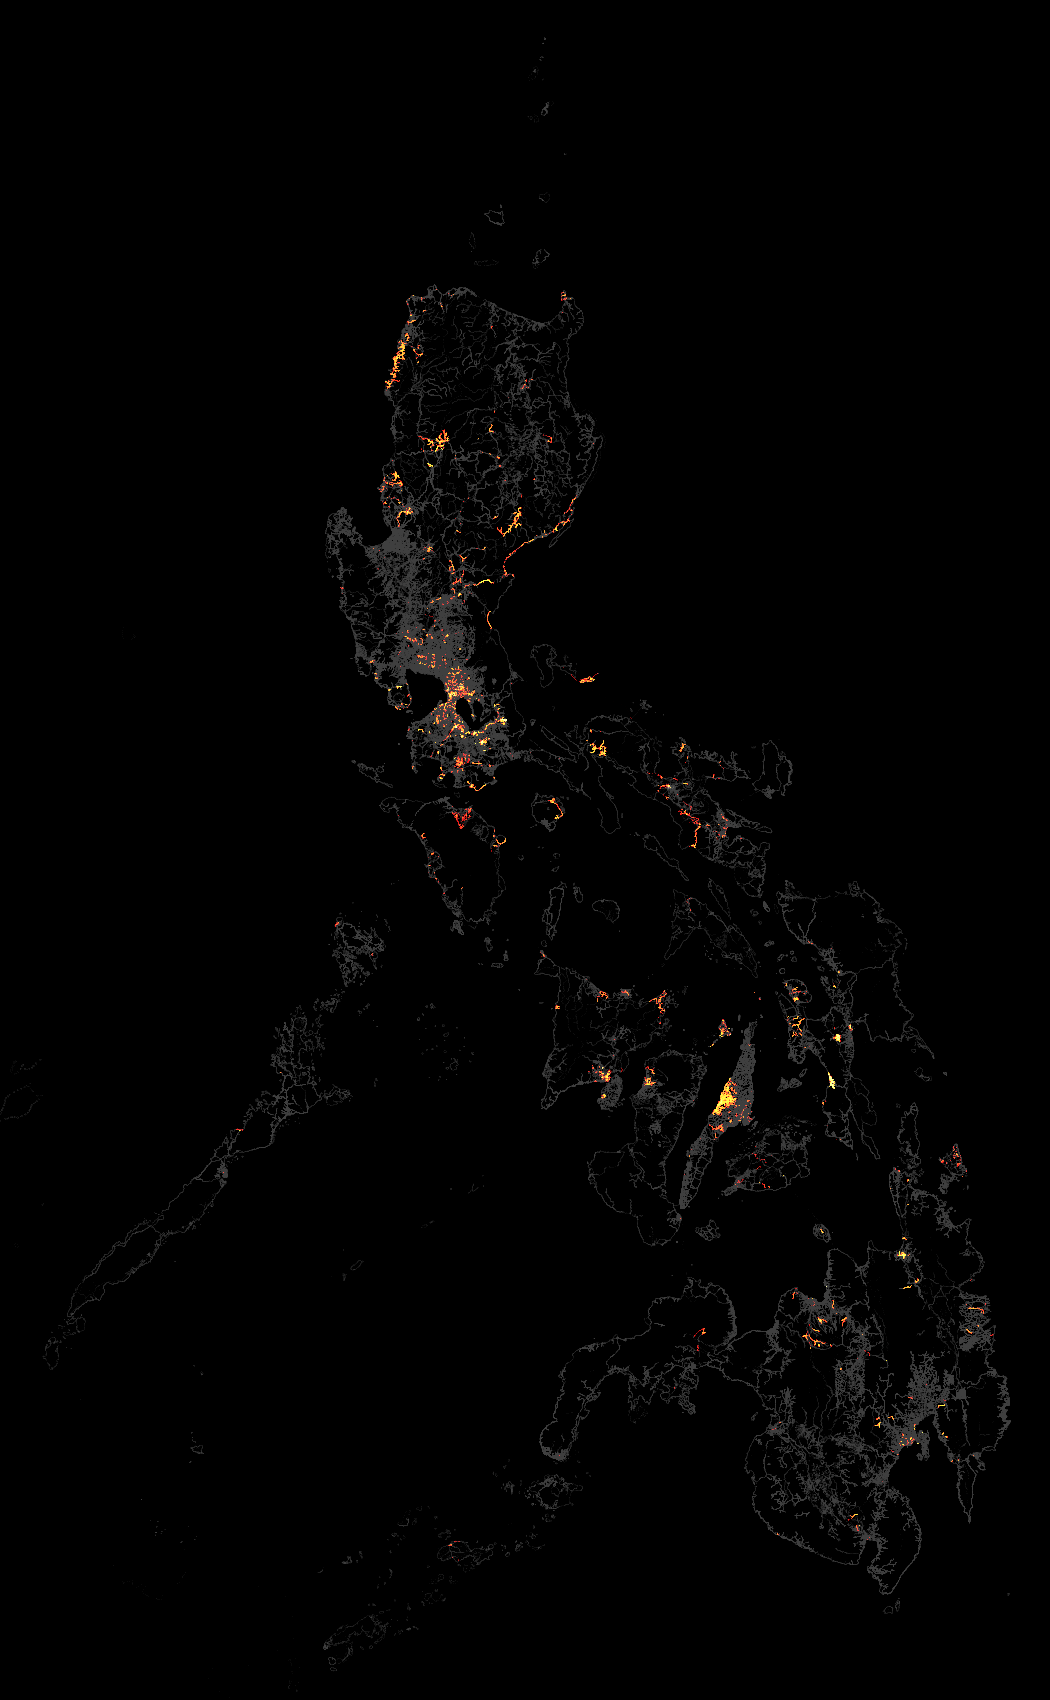
Hello everyone,

To visually see the data stats that I sent in my previous email, please
check out the following node density increase map from September 30 to
November 14:
http://wiki.openstreetmap.org/w/images/e/e1/Philippines_node_density_increase_from_2013-09-30_to_2013-11-14.png
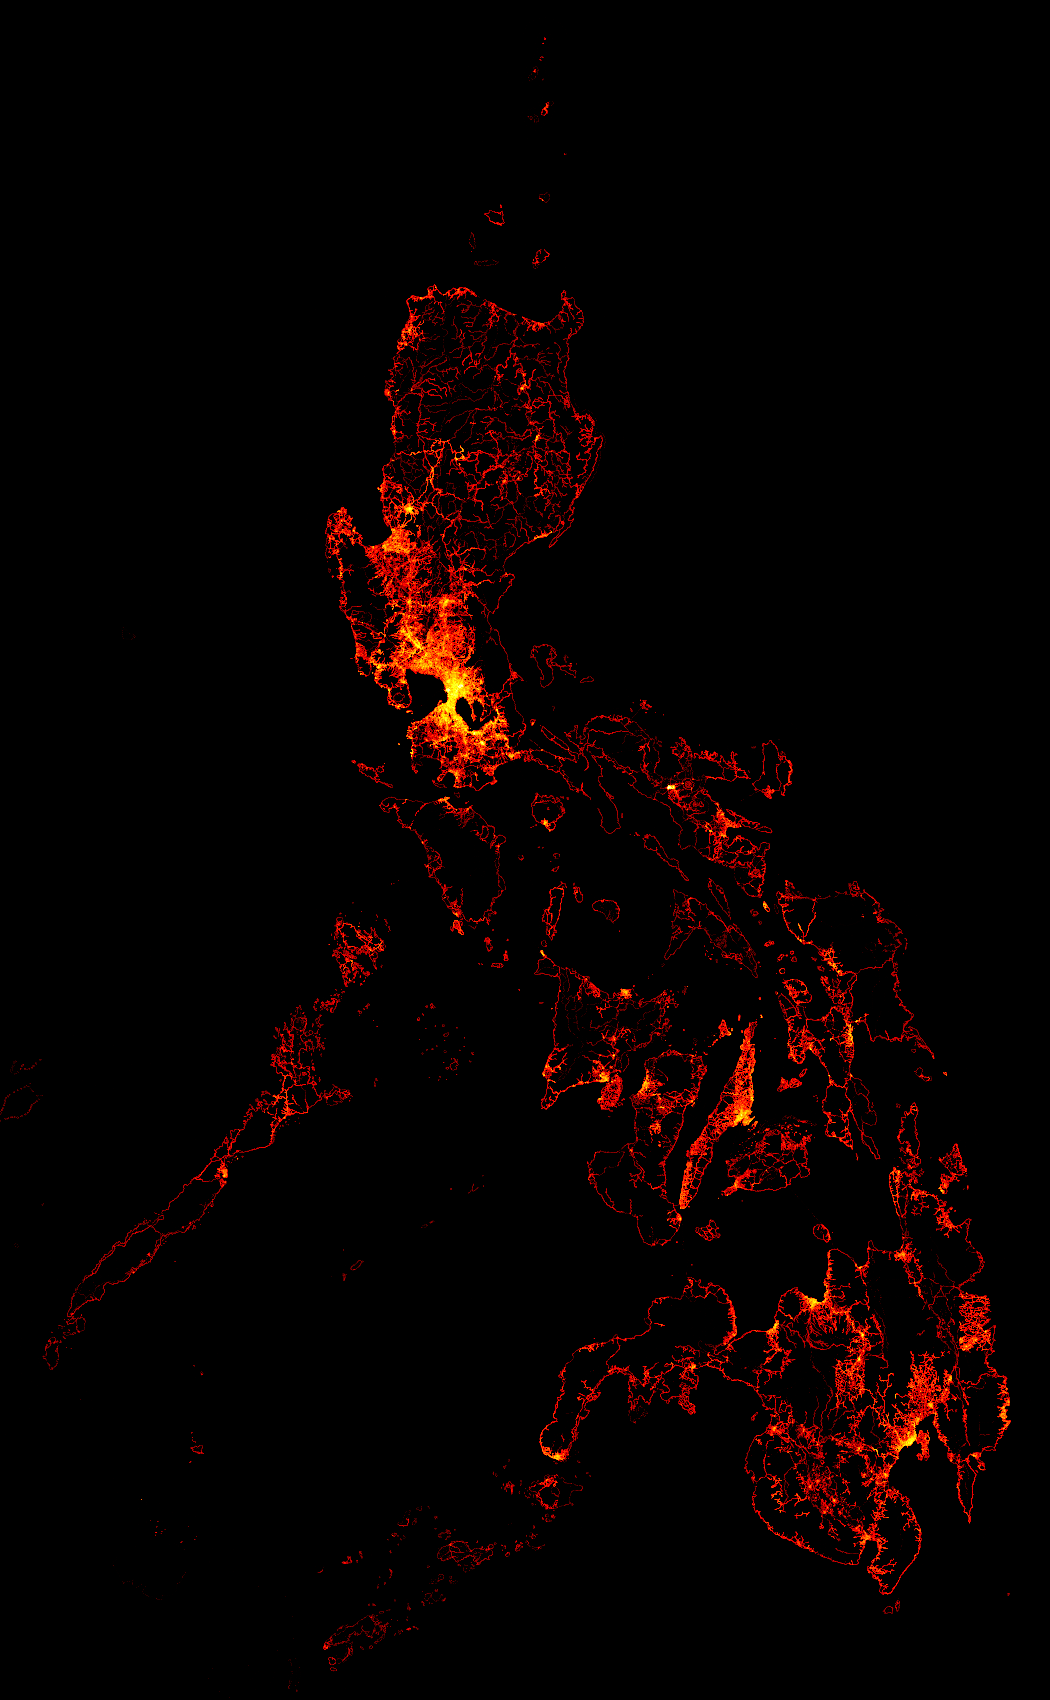
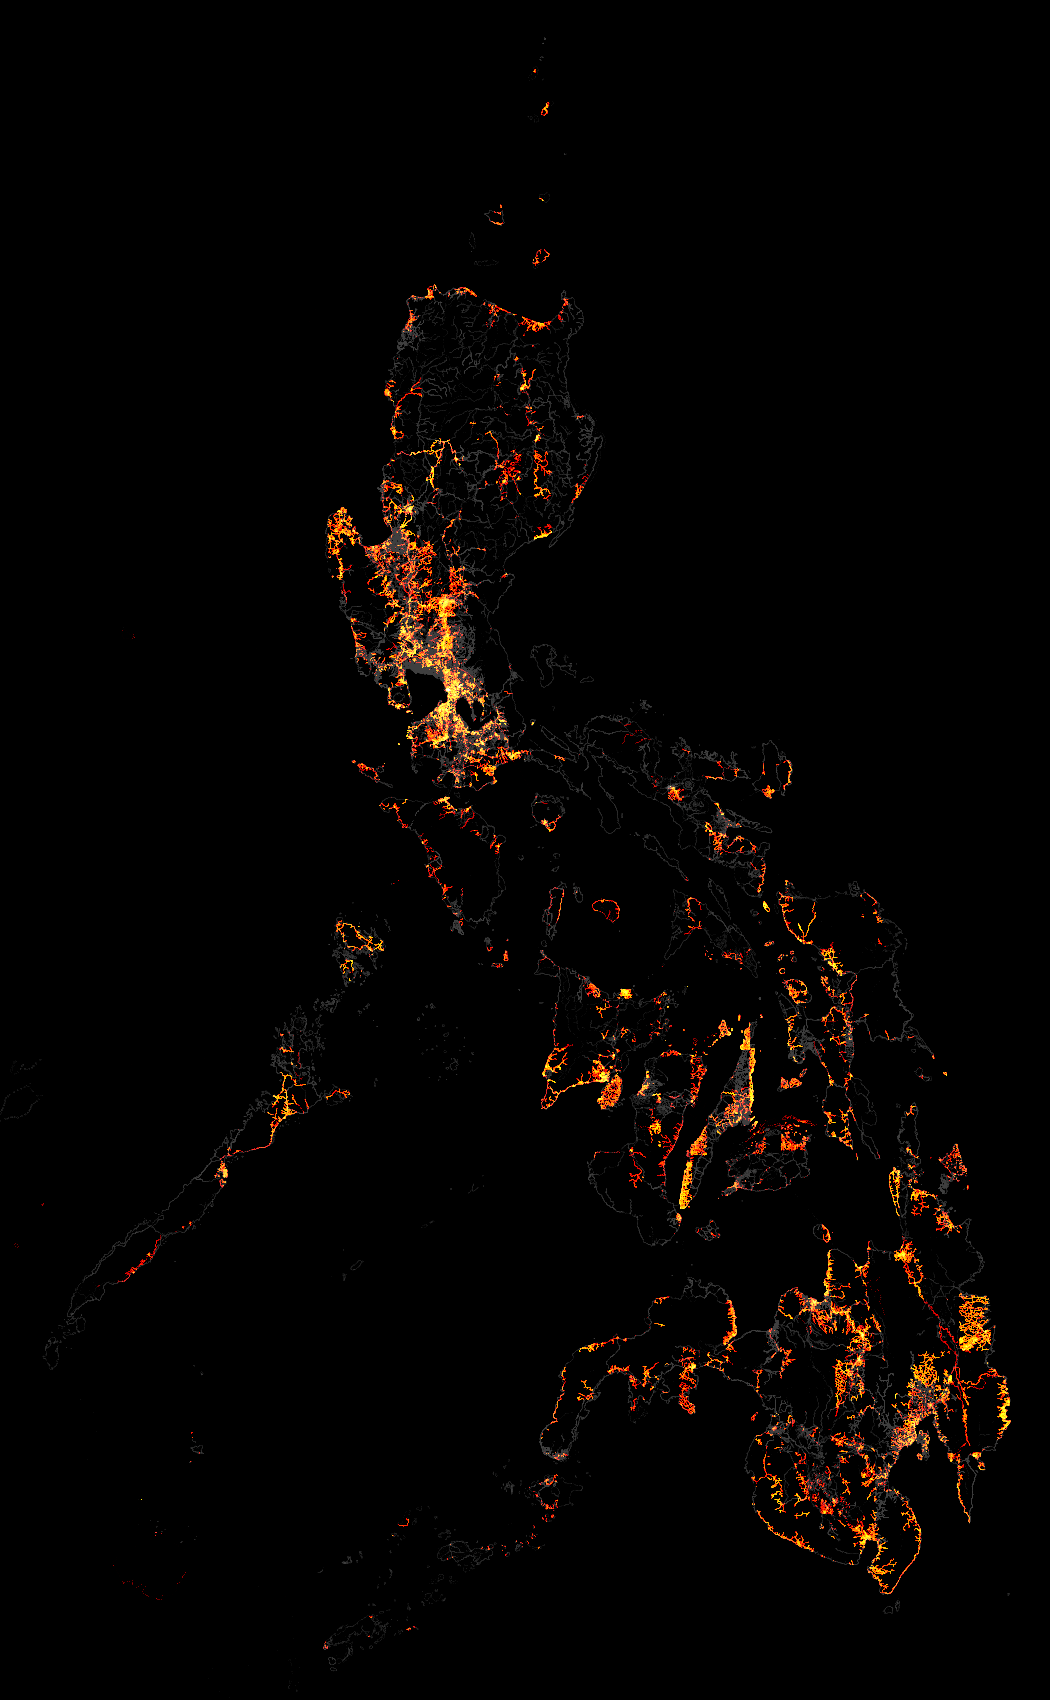
The significant group mapping activities since September 30 that are quite
visible on this node density map are:

1. ESSC-OSMPH trainings in Pampanga (Candaba, Lubao, and Guagua)
2. HOT mapping due to the 7.2-M earthquake in Bohol (see the bright spot
around Tagbilaran)
3. HOT mapping due to Typhoon Haiyan/Yolanda

Here's the absolute node density map as of November 14:
http://wiki.openstreetmap.org/w/images/a/a3/Philippines_node_density_2013-11-14.png


On Thu, Oct 3, 2013 at 11:20 PM, Eugene Alvin Villar <sea...@gmail.com>wrote:

> Hi guys,
>
> Here's the 2013 3rd-quarter updated to the node density visualization.
>
> Absolute node density as of September 30, 2013:
>
> http://wiki.openstreetmap.org/wiki/File:Philippines_node_density_2013-09-30.png<http://wiki.openstreetmap.org/w/images/8/82/Philippines_node_density_2013-06-30.png>
>
> Node density increase from April 1, 2013 to June 30:
>
> http://wiki.openstreetmap.org/wiki/File:Philippines_node_density_increase_from_2013-06-30_to_2013-09-30.png<http://wiki.openstreetmap.org/w/images/d/d1/Philippines_node_density_increase_from_2013-04-01_to_2013-06-30.png>
>
> Some observations:
>
> - There is a noticeable rectangle of activity around Metro Manila. I
> believe this is the waterways project Maning mentioned before:
> https://lists.openstreetmap.org/pipermail/talk-ph/2013-September/004595.html
>
> - There's quite a bit of unusual editing activity in Palawan and its
> outlying islands in the Sulu Sea. I think most of the editors here are
> foreigners
>
> - I think the 2 brightest areas of activity are in Taytay (c/o Rally) and
> San Pablo (c/o dandel, a new user who's been tracing hundreds of building
> outlines lately)
>
> - Zamboanga City has seen some recent activity (thanks Ervin and Ian!) due
> to the conflict there
>
> - There's a lot of editing going on in central Bicol thanks to the new
> satellite imagery in that area
>
>
>
> On Wed, Jul 3, 2013 at 8:08 AM, Eugene Alvin Villar <sea...@gmail.com>wrote:
>
>> Hi guys,
>>
>> Here's the 2013 mid-year updated to the node density visualization.
>>
>> Absolute node density as of June 30, 2013:
>>
>> http://wiki.openstreetmap.org/w/images/8/82/Philippines_node_density_2013-06-30.png
>>
>> Node density increase from April 1, 2013 to June 30:
>>
>> http://wiki.openstreetmap.org/w/images/d/d1/Philippines_node_density_increase_from_2013-04-01_to_2013-06-30.png
>>
>> An area that had significant mapping is a portion of northwestern Cebu.
>> Cebu now appears to be the most complete-looking major island right now in
>> the Philippines. :-)
>>
>> Keep on mapping!
>>
>>
>>
>> On Wed, Apr 3, 2013 at 7:25 AM, Eugene Alvin Villar <sea...@gmail.com>wrote:
>>
>>> Hi guys,
>>>
>>> Here's the 2013 1st quarter update to the node density visualizations.
>>>
>>> Absolute node density as of April 1, 2013:
>>>
>>> http://wiki.openstreetmap.org/wiki/File:Philippines_node_density_2013-04-01.png
>>>
>>> Node density increase from January 1, 2013 to April 1, 2013:
>>>
>>> http://wiki.openstreetmap.org/wiki/File:Philippines_node_density_increase_from_2013-01-01_to_2013-04-01.png
>>>
>>> Some of the places that have noticeable improvements include:
>>> - Cagayan Valley
>>> - northern Cebu (thanks to Totor)
>>> - Mindanao's Rio Grande rivers/tributaries (thanks to maning)
>>> - Camiguin (thanks to Schadow1)
>>> - eastern Mindanao, specifically the areas hit by Typhoon Pablo (thanks
>>> to HOT)
>>>
>>>
>>> Keep on mapping!
>>>
>>>
>>>
>>> On Wed, Jan 9, 2013 at 4:44 AM, Eugene Alvin Villar <sea...@gmail.com>wrote:
>>>
>>>> Hi guys,
>>>>
>>>> Here's a new year update to the node density visualizations.
>>>>
>>>> Here is the absolute node density as of January 1, 2013:
>>>>
>>>> http://wiki.openstreetmap.org/w/images/f/f2/Philippines_node_density_2013-01-01.png
>>>>
>>>> And here's the node density increase comparing January 2, 2012 and
>>>> January 1, 2013:
>>>>
>>>> http://wiki.openstreetmap.org/w/images/5/5b/Philippines_node_density_increase_from_2012-01-02_to_2013-01-01.png
>>>>
>>>> The increase in the number of nodes last year is pretty much
>>>> distributed throughout the archipelago. The most number of increase is in
>>>> the Quiapo area and this is due to maning's project there.
>>>>
>>>> Good work everyone! Let's make 2013 even better. :)
>>>>
>>>
>>>
>>
>
_______________________________________________
talk-ph mailing list
talk-ph@openstreetmap.org
https://lists.openstreetmap.org/listinfo/talk-ph