On Tue, May 15, 2018 at 3:27 PM, Hal Murray <[email protected]> wrote:
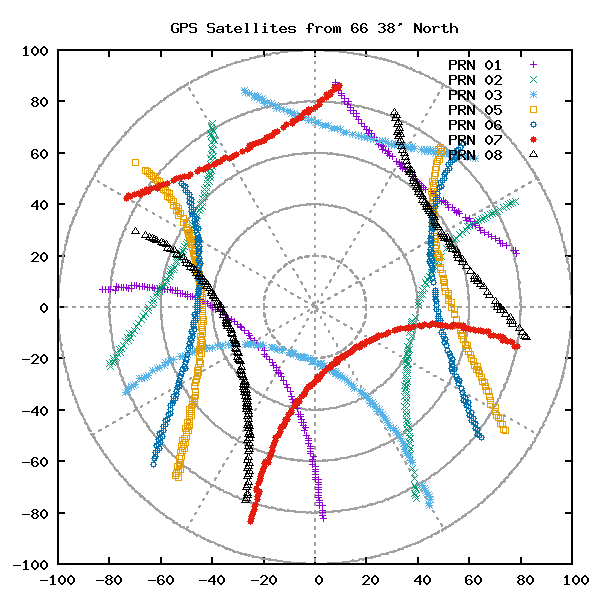
>
> If you are far enough north, you are in the hole, but you can see the
> other
> side of the hole over the pole.
>
> It's not hard to make your own plots.  This is from 66 38' north.
>   http://users.megapathdsl.net/~hmurray/time-nuts/Arctic/Polar-A.png
>
> If anybody wants to play, I'll put the code on the web.
>
> There are several steps.  First is to collect the data.  I have a python
> script that grabs everything from a NMEA device and logs each line with a
> time stamp.  The GPS orbit period is 12 hours so you need 12 hours of data
> to
> see everything.  But there are 30 satellites, so a few hours will show the
> hole.
>
> The next step is to extract the data into a useful format.  That's another
> python script.  Then, just feed that to gunplot.
>

Hi Hal,

I'd like to see a copy of the code, please.

Thanks!

--
Chase Turner
W4TI
http://w4ti.com
_______________________________________________
time-nuts mailing list -- [email protected]
To unsubscribe, go to https://www.febo.com/cgi-bin/mailman/listinfo/time-nuts
and follow the instructions there.