On 02/04/2013 04:59 PM, Chuck Sites wrote:
>
> The bottom line is I just don't understand the thinking of the Global
> Warming Deniers, the contrarians.   Global Warming is
> so blatantly obvious in the data, observations, theory and models that
> the only reason I can think that anyone would argue against it's
> reality is someone being paid to do so.   Either that or your just a
> plain gullible person.
>
>
What's blatantly obvious in the data is a correlation. But it's not
possible to prove causation from a correlation. That's just a fact. It
just means that CO2 is not an independent variable.
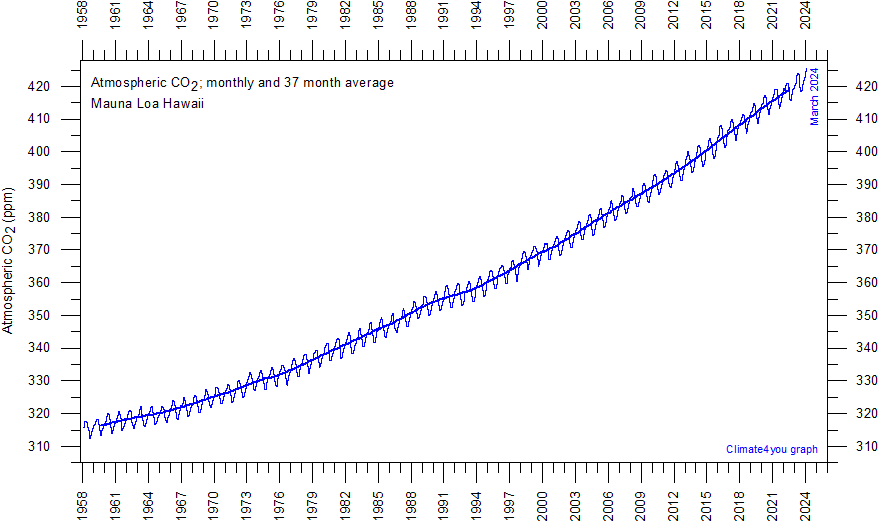
What I think is happening is that CO2 is contributing something to the
temperature rise, but it's also being pulled by the temperatures. We can
see this on an annual basis, as the CO2 level moves up and down in
response to seasonal temperature variations.

http://www.climate4you.com/images/CO2%20MaunaLoa%20MonthlySince1958.gif

But there's no way to know if CO2 is driving the correlation, or if it's
the temperature. So you have to guess and say, "Well, it's probably the
CO2 which is the primary cause of the change in temperature." It's just
a guess because you can't model the entire world, with all of its
complexities and feedback loops. Even if you know that CO2 WILL act as a
greenhouse gas in a sterile environment, you don't know how it's acting
in the atmosphere.

But check this out!

https://docs.google.com/file/d/0B4QESdNmbCJSMHExcF9OVFRQSGM/edit?usp=sharing

Just the simple correlation between temperature and sunspots is 0.81!

So if the simple correlation between temperature and sunspots is 0.81
and the simple correlation between temperature and CO2 is 0.96, then
isn't it 'possible' that solar activity is driving the temperature and
the temperature is driving the CO2 increases -- to SOME degree?

Since there is no logical way that temperature changes could drive solar
activity, then solar activity is driving the temperature to some degree.
That's the only thing that makes sense. CO2 may be affecting it
somewhat, but it's not the only thing.

Craig

PS: I put the worksheet together. It averages temperature anomalies and
sunspots over each solar cycle. I am basically compiling a total number
of sunspots for each solar cycle, and then subtracting a base number. If
the number of sunspots is greater than the base number, then
temperatures go up. If the number of sunspots is less than the base
number, then temperatures go down. Then I'm scaling down the curve, and
centering it, but that's it. There's no forward referencing or any thing
else. It also correlates to temperature at 0.916 from 1954 'til present.