I have now uploaded a summary of the figures for the UK coverage estimates
as a CSV file here - http://www.reedhome.org.uk/Documents/OSMCoverage.csv
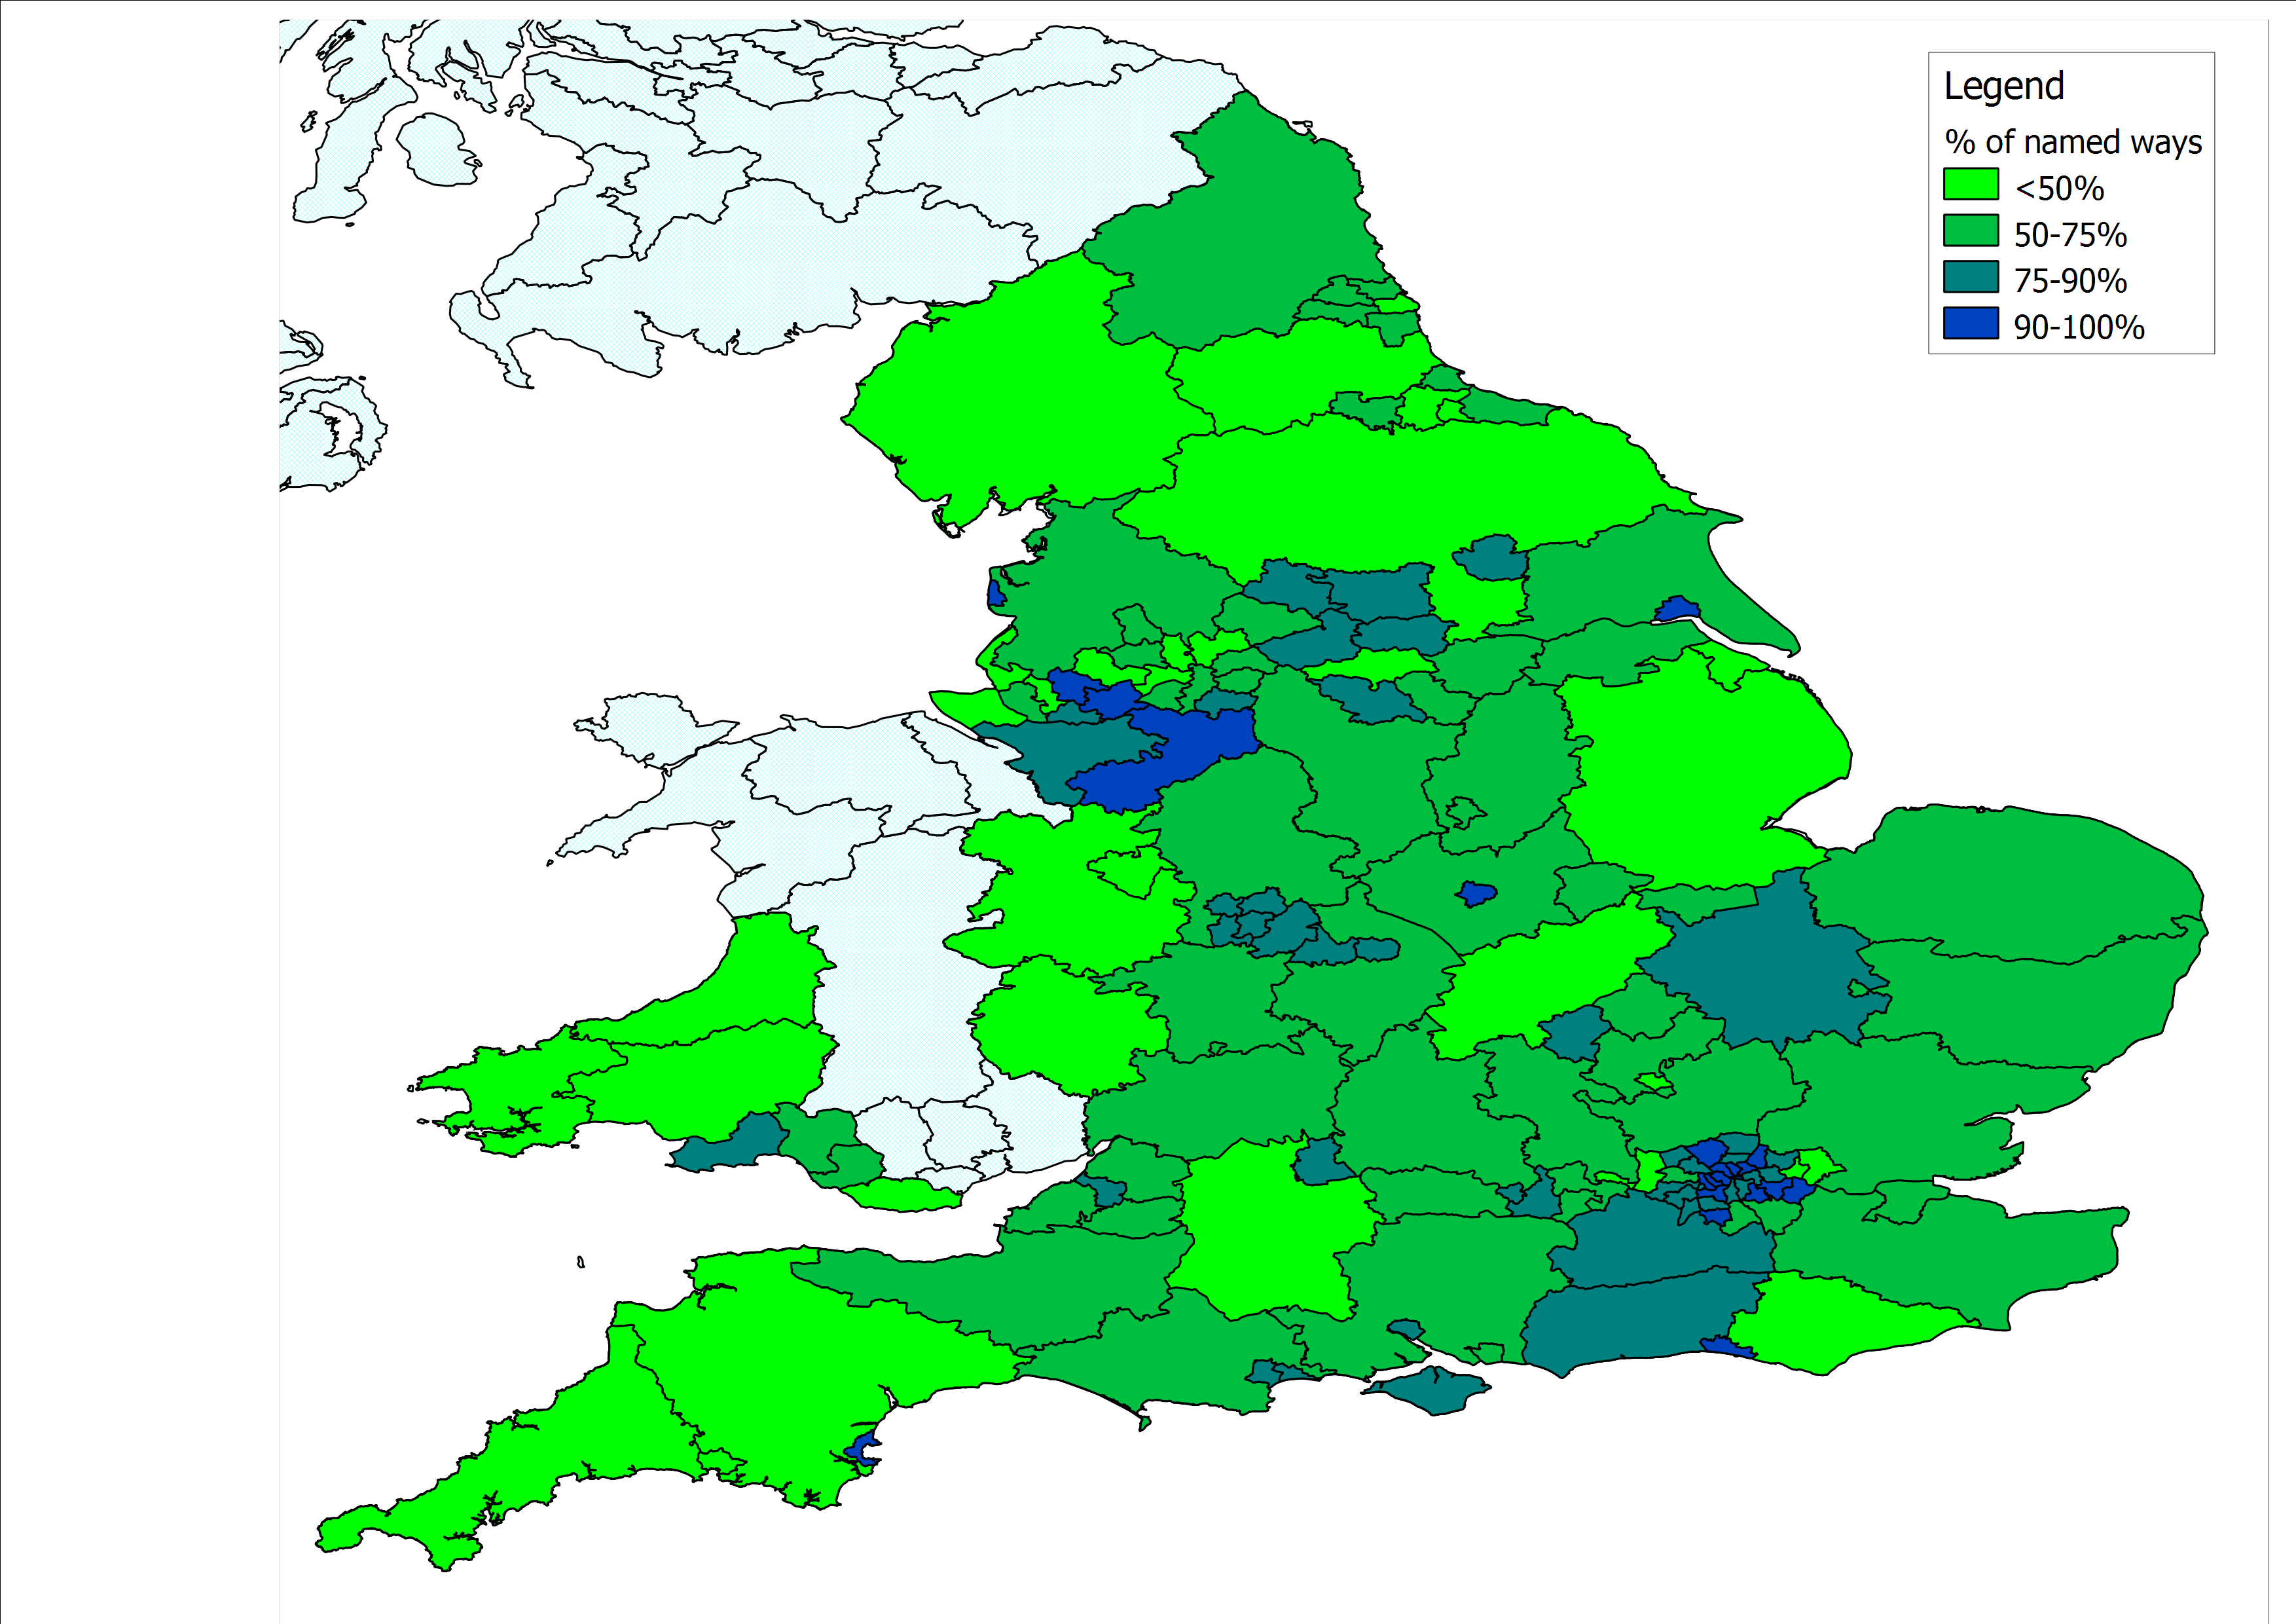
Several people have expressed an interest in seeing the proportion of named
roads by local authority area. Those figures are included in the table.
There is also a map here - http://www.reedhome.org.uk/Documents/OSMNamed.png


The other figure that may be of interest is the proportion of roads that
have been plotted, but not completely tagged. See the column labelled
"Percent other" in the CSV file.


These roads are not included in my totals, because I can't tell what type
they are. Broadly speaking these are roads marked as "highway" with a type
of "road" or "fixme". There are also a few that have been mis-tagged, for
example as <highway:some street name> or with a combination of conflicting
highway types. But these are a very small proportion of the total. Most are
tagged <highway:road> which is normally intended to mean "I know this road
is here, but I have not yet decided what type it is". The overall proportion
of these is quite low, but it is surprisingly high in some areas - notably
Luton, and Northumberland for example, where almost a third of roads that
have been plotted are not fully tagged with a type. Lincolnshire, Suffolk,
Somerset, Trafford, Norfolk and Wiltshire also show a high proportion (>10%)
of roads that I can't classify.


I thought that comparing the area enclosed by the admin boundary on OSM with
the area published by national statistics would be a good indicator of
whether the boundary was accurate. In practice it works sometimes, but not
others. I think this is mainly because of how the coastline and estuaries
are handled in different places. Bristol is the extreme -the government
thinks it is about twice as big as the area included in the boundary on OSM.


The CSV file also shows the breakdown between different types of road
(motorways, primary, secondary, etc). I've not looked closely at this yet,
but a quick scan suggest that the figures for primary roads and motorways
could sometimes be a good indicator of how accurate a boundary is. For
example, it looks as though the boundary for Luton on OSM includes a bigger
chunk of the M1 than the DfT believes they are responsible for.


Enjoy.
_______________________________________________
Talk-GB mailing list
Talk-GB@openstreetmap.org
http://lists.openstreetmap.org/listinfo/talk-gb