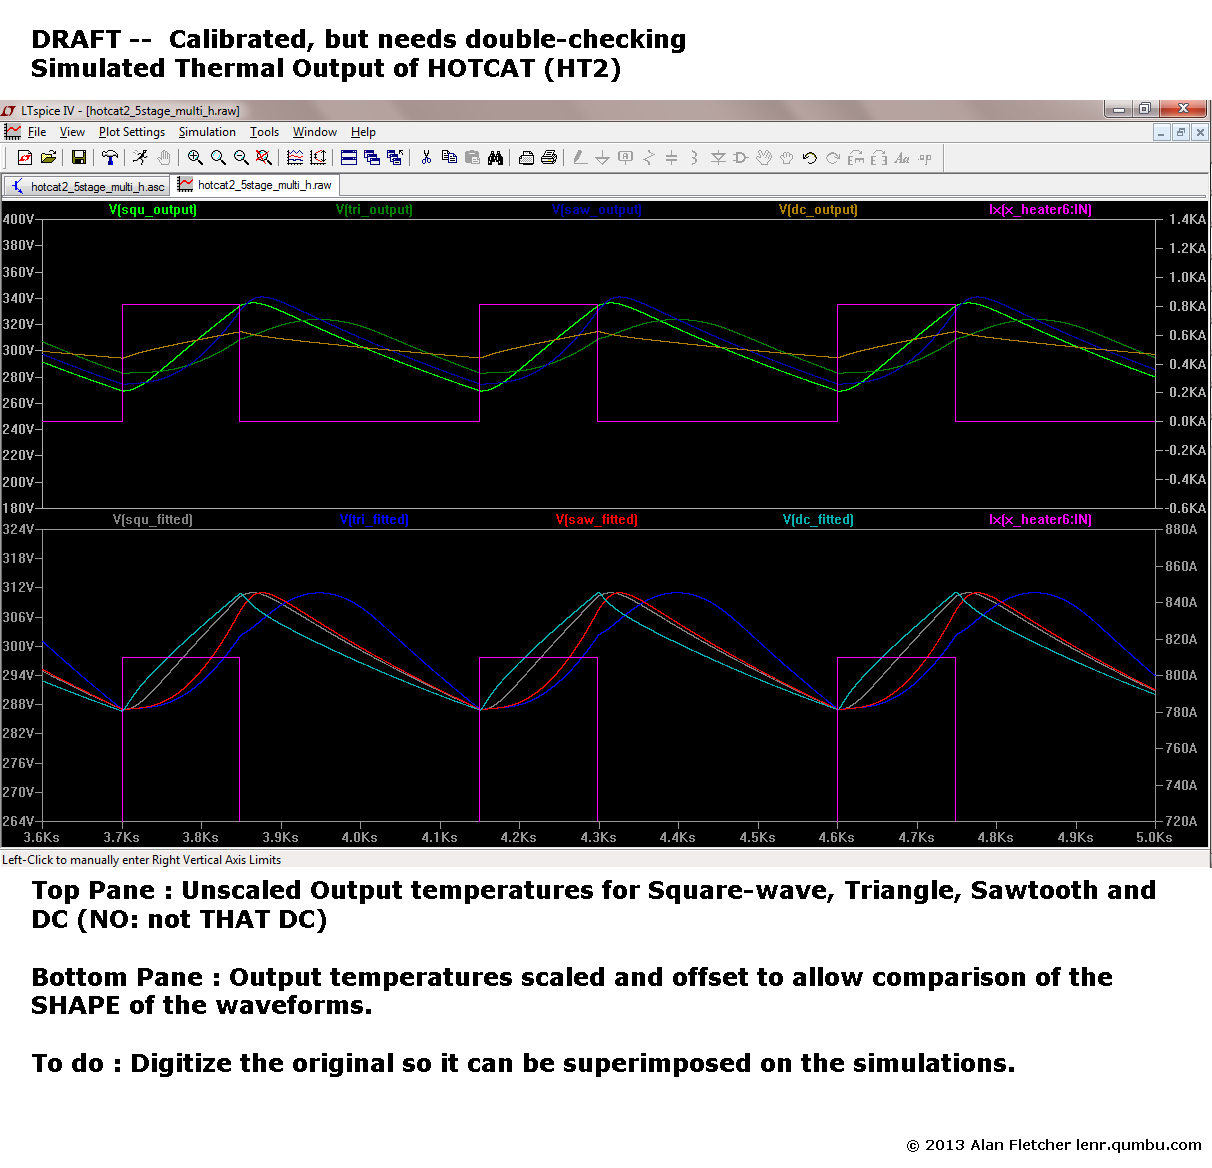
OK --- I have a calibrated (but still to be checked) run for the main waveforms
:
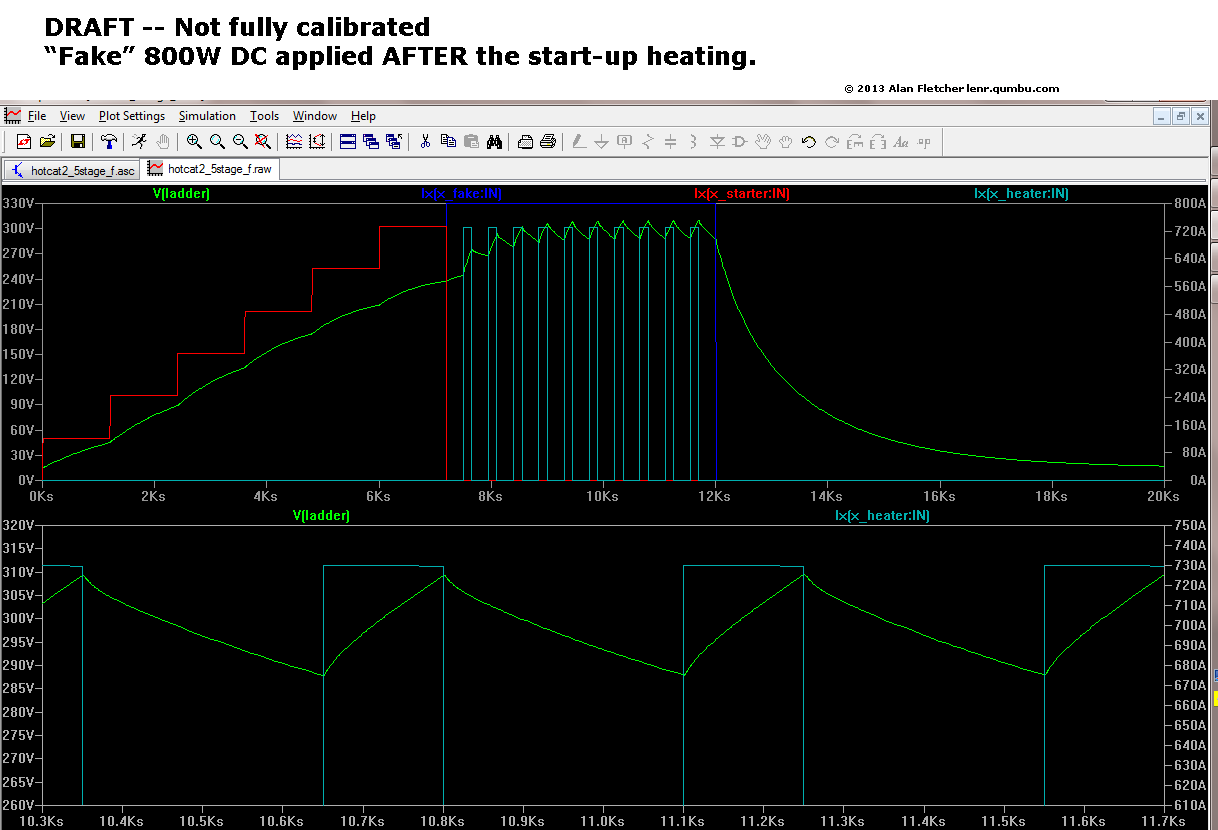
http://lenr.qumbu.com/web_hotcat_spice/130621_spice_02.png

Right now the Triangle/Sawtooth look the best (they differ only in the fall
time).

That "02" plot's for the output temperature. I'll get some preliminary plots
for the internal temperatures later (probably tomorrow).

Also, the following didn't get to vortex -- The Reply To  was wrong.

> From: "John Milstone" <john_sw_orla...@yahoo.com>
> Sent: Friday, June 21, 2013 12:01:07 PM

> FWIW, I put together a new version of "Plot 8" from the original
> report, showing the full Y axis and adding the power-in if the wire
> trick were being used.

> The chart is here: http://s10.postimg.org/btaoiv6eh/E_Cat_Power.png

You can't apply the "fake" DC during the start-up phase (which is in steps to
full power) --
you have to apply about 800W when the PULSED heater starts, to get it to the
operating temperature of 311 C (peak)
and then turn it off at the end of the run.

This is an uncallibrated draft:

http://lenr.qumbu.com/web_hotcat_spice/130621_spice_01.png

DC + Pulsed does NOT match the waveform

http://lenr.qumbu.com/web_hotcat_pics/130601_levi_12A.png
http://lenr.qumbu.com/web_hotcat_pics/130601_levi_15A.png